. 2012 Feb 15;26(4):369-83.
doi: 10.1101/gad.176156.111.

Targeted INO80 enhances subnuclear chromatin movement and ectopic homologous recombination

Affiliations

Targeted INO80 enhances subnuclear chromatin movement and ectopic homologous recombination

Frank R Neumann et al. Genes Dev. .

Abstract

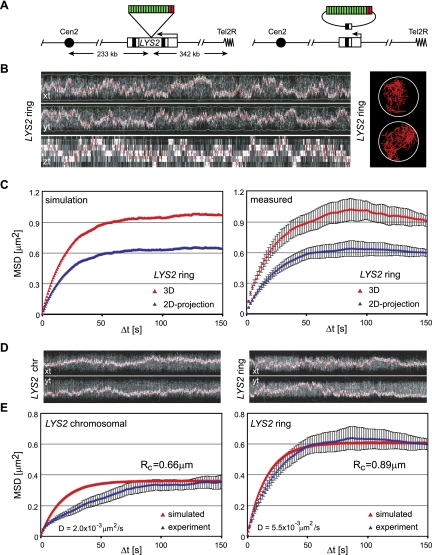
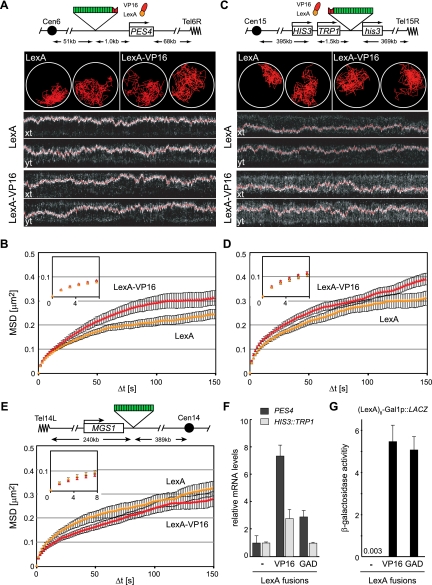
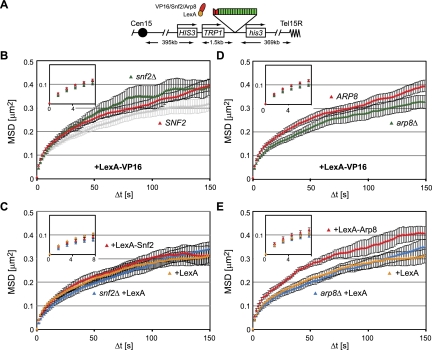
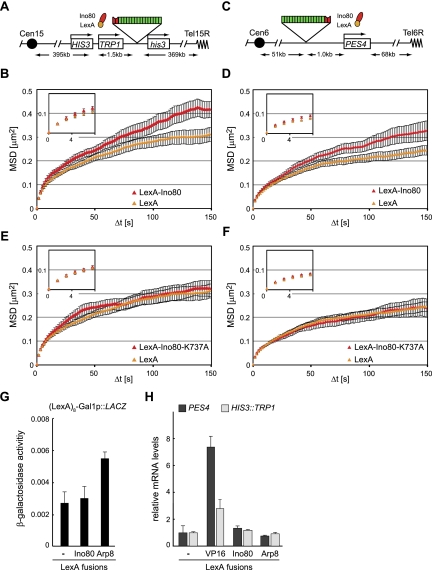
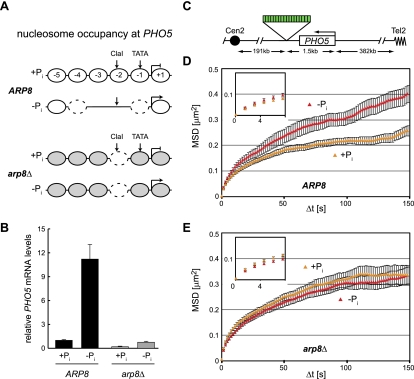
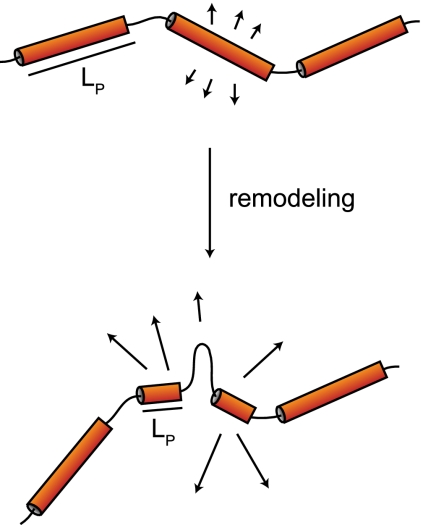
Chromatin in the interphase nucleus moves in a constrained random walk. Despite extensive study, the molecular causes of such movement and its impact on DNA-based reactions are unclear. Using high-precision live fluorescence microscopy in budding yeast, we quantified the movement of tagged chromosomal loci to which transcriptional activators or nucleosome remodeling complexes were targeted. We found that local binding of the transcriptional activator VP16, but not of the Gal4 acidic domain, enhances chromatin mobility. The increase in movement did not correlate strictly with RNA polymerase II (PolII) elongation, but could be phenocopied by targeting the INO80 remodeler to the locus. Enhanced chromatin mobility required Ino80's ATPase activity. Consistently, the INO80-dependent remodeling of nucleosomes upon transcriptional activation of the endogenous PHO5 promoter enhanced chromatin movement locally. Finally, increased mobility at a double-strand break was also shown to depend in part on the INO80 complex. This correlated with increased rates of spontaneous gene conversion. We propose that local chromatin remodeling and nucleosome eviction increase large-scale chromatin movements by enhancing the flexibility of the chromatin fiber.


Figures

Figure 1.
Figure 1.
Validation of chromatin movement analysis. (A) Map of the LYS2 locus on chromosome II. Site-specific recombination leads to excision of parts of the LYS2 gene and the lacO repeats (green boxes), resulting in an extrachromosomal ring of 16.5 kb. (B) Kymograph of a representative cell tracked over 7.5 min in 3D (left) and representative 2D projected traces (right). (C) The left panel shows simulated MSD plots generated using a constrained random walk model, which uses the diffusion coefficient measured experimentally (step size = 1 nm; RC = 900 nm) in both 3D (red) and the same simulations projected in 2D (blue). The right panel shows MSD curves from the same six 3D movies (7.5-min each) determined in 3D (red) or on a 2D projection (blue). The strain used was GA2627 after expression of the recombinase. The error bars represent the standard error of the mean. The agreement between the measured and simulated data for both 3D and 2D projection data, along with the smaller error in the latter, validates use of the 2D projection for analysis. (D) Representative kymographs of tracking data from typical time-lapse capture of the chromosomal LYS2 locus (left) and the excised ring (right). (E) MSD analysis of experimental values (blue) for the chromosomal LYS2 locus (eight movies of 7.5-min each in GA2627) (left) and the excised ring (six movies of 7.5-min each after expression of the recombinase in GA2627) (right) overlaid onto in silico simulated curves (red). The movement of the chromosomal LYS2, unlike the excised ring, does not fit a random walk model, reflecting constraint by the chromosomal fiber. “D” indicates diffusion coefficient, and “RC” indicates radius of constraint.
Figure 2.
Figure 2.
LexA-VP16 targeting increases chromatin movement of two independent loci. (A) Using the methodology of Figure 1C, we tracked the movement of the PES4 locus in GA1461 and GA4500, captured using a spinning disc confocal microscope. The locus contains four LexA-binding sites (red) and a lacO array (green). Two representative traces and kymographs (2D projections) over a 5-min time-lapse movie showing the marked locus along the X-axis and Y-axis are provided. (B) MSD analysis of movement of the PES4 locus after targeting LexA alone (yellow) or the LexA-VP16 activation domain (red). The inset shows the first five time points (7.5 sec) from which the diffusion coefficient is calculated. Error bars for MSD plots correspond to the standard error. Quantitative details from the analysis are found in Table 1. (C) As in A, but monitoring the LexA- and lacO-tagged locus HIS3 (in GA3441). Two representative traces and kymograph representations of cells showing the tracked locus along the X-axis and Y-axis. (D) MSD analysis of HIS3 in GA3441 after expression of LexA alone (yellow) or the LexA-VP16 activation domain (red). (E) Map and MSD analysis of the MGS1 locus in GA1590, which does not contain LexA-binding sites, after expressing LexA alone (yellow) or LexA-VP16 (red). (F) Relative transcript levels of PES4 (black) and TRP1 (inserted at the HIS3 locus [light gray]) quantified by real-time RT–PCR from total mRNA and normalized to ACT1 after targeting LexA, LexA-VP16, or LexA-GAD. The error bars represent the standard error of three independent RNA preparations. (G) β-Galactosidase reporter assay on strains carrying pSH18-34, which contains the LacZ gene preceded by eight LexA-binding sites and the core promoter of GAL1, during coexpression of LexA, LexA-VP16, or LexA-GAD.
Figure 3.
Figure 3.
Snf2 and Arp8 have differential effects on chromatin movement. (A) Map of the HIS3 locus with lacO-binding sites (green) and LexA-binding sites (red). (B) MSD plots from time-lapse imaging of the HIS3 locus in SNF2 (GA3441 [red]) and snf2Δ (GA3444 [green]) cells expressing LexA-VP16, and SNF2 (GA3441) cells expressing LexA alone (light gray) performed and analyzed as in Figure 2, A and B. (C) SNF2 cells (GA3441) expressing either LexA (yellow) or LexA-Snf2 (red) along with snf2Δ (GA3444 [blue]) expressing LexA alone. (D) MSD plots obtained as in Figure 2, A and B, showing ARP8 (GA3441 [red]) and arp8Δ (GA6447 [green]) expressing LexA-VP16 (plasmid no. 2007). (E) MSD analysis of ARP8 cells (GA3441) expressing either LexA (yellow) or LexA-Arp8 (red) along with arp8Δ cells (GA6447) expressing LexA alone (blue).
Figure 4.
Figure 4.
INO80 tethering promotes chromatin movement and requires the ATPase activity of the complex. (A) Map of the HIS3 locus in GA3441. (B) MSD analysis presented as in Figure 2, A and B, showing the dynamics of the HIS3 locus in GA3441 expressing LexA alone (yellow) or LexA-Ino80 (red). (C) Map of the tagged PES4 locus in GA1461. (D) Tracking and resulting MSD plots of the PES4 locus in GA1461 cells expressing LexA alone (yellow) or LexA-Ino80 (red), performed as in Figure 2, A and B. (E,F) Tracking and resulting MSD curves of the HIS3 locus in GA3441 (E) or the PES4 locus in GA1461 (F) upon targeting of LexA alone (yellow) or LexA-Ino80K737A (red), a mutant incapable of binding ATP. (G) β-Galactosidase reporter assay as in Figure 2G. LexA, LexA-Ino80, or LexA-Arp8 are expressed in cells carrying a reporter construct of the LacZ gene preceded by eight LexA-binding sites and the GAL1 core promoter (pSH18-34). (H) Relative transcript levels of TRP1 (inserted at the HIS3 locus) in GA3441 (light gray) and of PES4 in GA1461 (black) upon targeting of LexA, LexA-VP16, LexA-Ino80, or LexA-Arp8. The expression levels were normalized to ACT1.
Figure 5.
Figure 5.
The mobility of the PHO5 locus depends on Arp8. (A) Representation of the nucleosome occupancy at the PHO5 promoter in the presence and absence of phosphate (Pi) in ARP8 cells as summarized by Ertel et al. (2010). In arp8Δ cells, the ClaI site is partially accessible with and without phosphate, as shown by Steger et al. (2003). The nucleosomes in gray have not been assayed for stability in this mutant. (B) PHO5 mRNA levels in the presence or absence of phosphate in ARP8 (GA7333 [black]) and arp8Δ (GA7347 [gray]) strains. The PHO5 levels were normalized to ACT1, and the repressed conditions in the ARP8 cells were arbitrarily set to 1 for easy comparisons. (C) Map of the PHO5 locus where we inserted a LacO array for monitoring movement in GA7333 and GA7347. (D,E) MSD plots as in Figure 2B showing the movement of the PHO5 locus with (yellow) and without (red) phosphate in ARP8 cells (GA7333) (D) and arp8Δ cells (GA7347) (E).
Figure 6.
Figure 6.
Targeting VP16 and INO80 to a recombination substrate increases the rates of GC. (A) An I-SceI cut site (I-SceIcs) was inserted at the ZWF1 locus on Chr XIV (see the Materials and Methods). The locus is marked by a lacO/CFP-LacI system, and Rad52-YFP is recruited to sites of I-SceI-induced cleavage. The endonuclease I-SceI is under the control of the GAL1 promoter. (B). The movement of the Rad52-YFP focus in arp8Δ mutant cells (GA6318 [violet curve]) is partially diminished in comparison with that of ARP8+ cells (GA6208 [red curve]). Tracking and MSD were performed as in Figure 2B. (C) Map of the relevant sites for GC by HR in GA3232. Sequences were inserted in the lys2 gene on Chr II, generating frameshifts in all reading frames (Freedman and Jinks-Robertson 2002). LexA-binding sites (red) are inserted upstream of the gene (Nagai et al. 2008). The inactive lys2 copy on Chr V carries a 3′ truncation. Recombination by GC restores a functional LYS2, allowing growth on medium lacking lysine. LexA constructs driven by the Tet-off promoter allowed the induction only during the 3-d period of growth before selection of cells on plates lacking lysine. (D) Lys+ colonies were scored for GA3232 transformed with plasmids expressing the indicated LexA fusion (at least eight independent transformants for each construct). Recombination rates for strains carrying the LexA-binding sites were divided by those of strains without the binding sites (GA3208) and normalized to that of cells expressing LexA alone. (E) Details of the recombination rates, including the 95% confidence interval.
Figure 7.
Figure 7.
Model of how chromatin remodeling leads to enhanced movement. Folded chromatin domains, represented by stiff tubes, have rather large persistent length (LP) values compared with the flexible unfolded regions of chromatin. Upon local nucleosome remodeling and/or eviction, the persistent length is reduced, creating an extra flexible linker that may exhibit freer movement.

References

    1. Barbaric S, Luckenbach T, Schmid A, Blaschke D, Horz W, Korber P 2007. Redundancy of chromatin remodeling pathways for the induction of the yeast PHO5 promoter in vivo. J Biol Chem 282: 27610–27621 - PubMed
    1. Berg HC. 1993. Random walks in biology. Princeton University Press, Princeton, NJ.
    1. Berger SL, Pina B, Silverman N, Marcus GA, Agapite J, Regier JL, Triezenberg SJ, Guarente L 1992. Genetic isolation of ADA2: A potential transcriptional adaptor required for function of certain acidic activation domains. Cell 70: 251–265 - PubMed
    1. Boeger H, Griesenbeck J, Strattan JS, Kornberg RD 2004. Romoval of promoter nucleosomes by disassembly rather than sliding in vivo. Mol Cell 14: 667–673 - PubMed
    1. Bupp JM, Martin AE, Stensrud ES, Jaspersen SL 2007. Telomere anchoring at the nuclear periphery requires the budding yeast Sad1–UNC-84 domain protein Mps3. J Cell Biol 179: 845–854 - PMC - PubMed

Publication types

MeSH terms

Substances

LinkOut - more resources