

Metabolite identification and quantitation in LC-MS/MS-based metabolomics
- PMID: 22345829
- PMCID: PMC3278153
- DOI: 10.1016/j.trac.2011.08.009
Metabolite identification and quantitation in LC-MS/MS-based metabolomics
Abstract
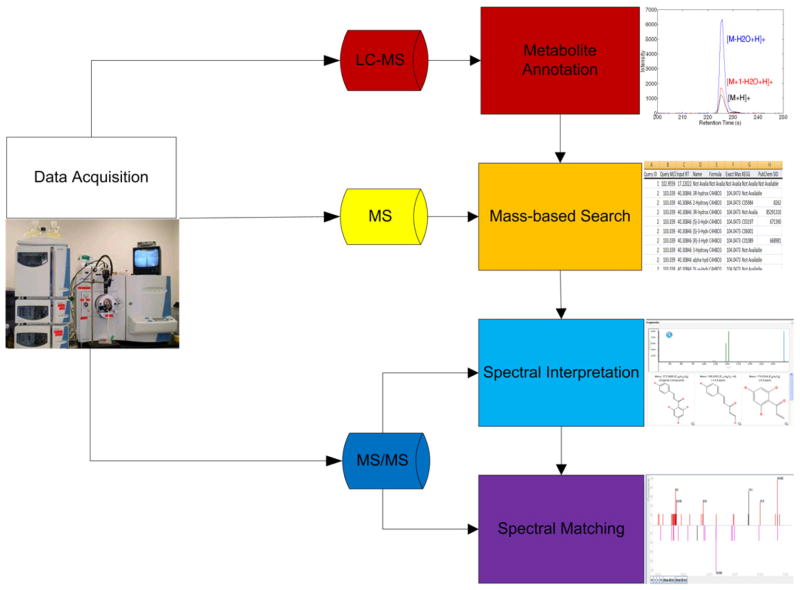
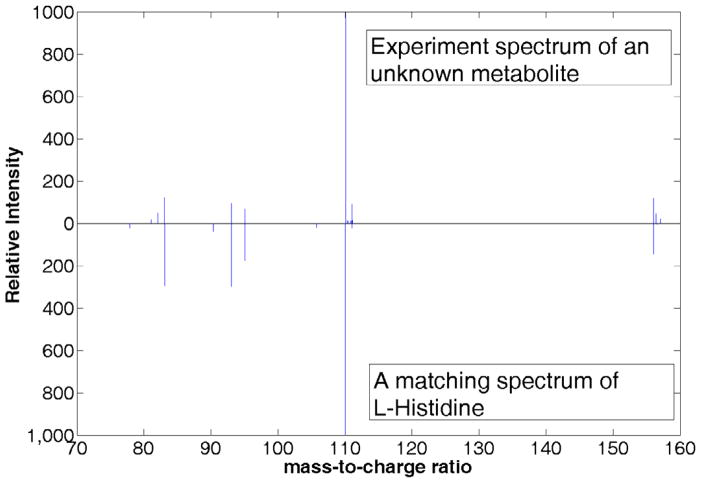
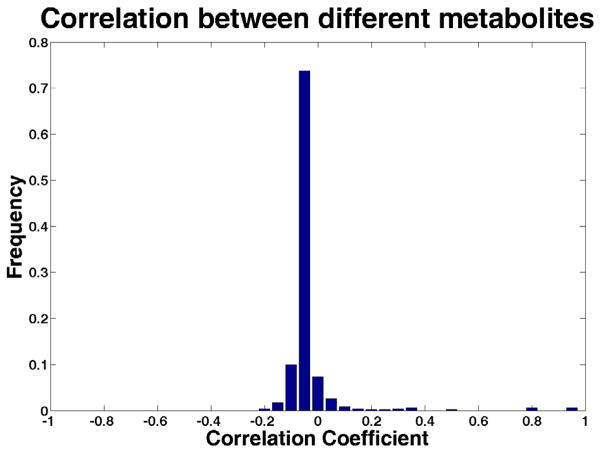
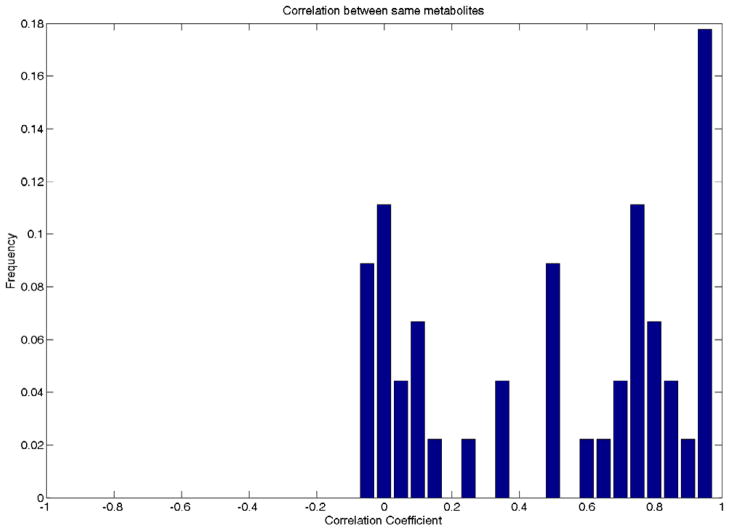
Metabolomics aims at detection and quantitation of all metabolites in biological samples. The presence of metabolites with a wide variety of physicochemical properties and different levels of abundance challenges existing analytical platforms used for identification and quantitation of metabolites. Significant efforts have been made to improve analytical and computational methods for metabolomics studies.This review focuses on the use of liquid chromatography with tandem mass spectrometry (LC-MS/MS) for quantitative and qualitative metabolomics studies. It illustrates recent developments in computational methods for metabolite identification, including ion annotation, spectral interpretation and spectral matching. We also review selected reaction monitoring and high-resolution MS for metabolite quantitation. We discuss current challenges in metabolite identification and quantitation as well as potential solutions.
Figures
References
-
- Bowen BP, Northen TR. J Am Soc Mass Spectrom. 2010;21:1471. - PubMed
-
- Rosenblum ES, Viant MR, Braid BM, Moore JD, Friedman CS, Tjeerdema RS. Metabolomics. 2005;1:199.
-
- Griffiths WJ, Koal T, Wang Y, Kohl M, Enot DP, Deigner HP. Angew Chem, Int Ed Engl. 2010;49:5426. - PubMed
-
- Saito K, Matsuda F. Annu Rev Plant Biol. 2010;61:463. - PubMed
-
- Oliver SG, Winson MK, Kell DB, Baganz F. Trends Biotechnol. 1998;16:373. - PubMed
Grants and funding
LinkOut - more resources
Full Text Sources
Other Literature Sources