

Testing synchrony in historical biogeography: the case of new world primates and hystricognathi rodents
- PMID: 22346342
- PMCID: PMC3273932
- DOI: 10.4137/EBO.S9008
Testing synchrony in historical biogeography: the case of new world primates and hystricognathi rodents
Abstract
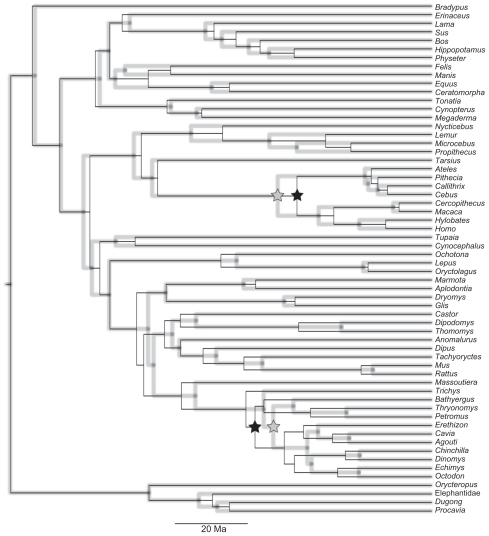
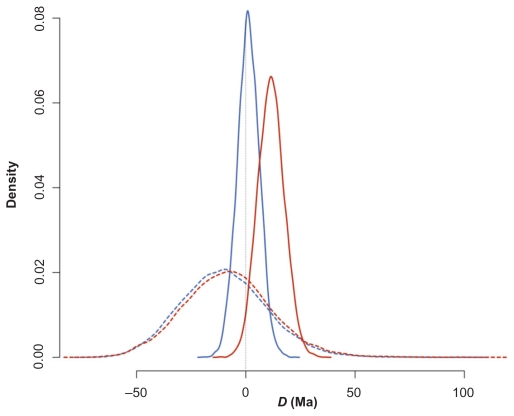
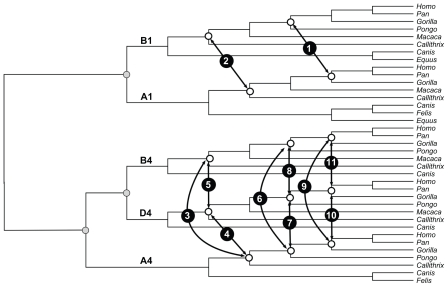
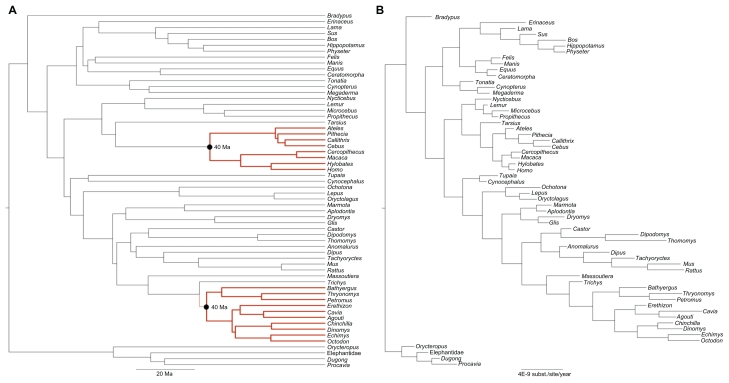
The abrupt appearance of primates and hystricognath rodents in early Oligocene deposits of South America has puzzled mastozoologists for decades. Based on the geoclimatic changes that occurred during the Eocene/Oligocene transition period that may have favoured their dispersal, researchers have proposed the hypothesis that these groups arrived in synchrony. Nevertheless, the hypothesis of synchronous origins of platyrrhine and caviomorph in South America has not been explicitly evaluated. Our aim in this work was to apply a formal test for synchronous divergence times to the Platyrrhini and Caviomorpha splits. We have examined a previous work on platyrrhine and hystricognath origins, applied the test to a case where synchrony is known to occur and conducted simulations to show that it is possible to formally test the age of synchronous nodes. We show that the absolute ages of Platyrrhini/Catarrhini and Caviomorpha/Phiomorpha splits depend on data partitioning and that the test applied consistently detected synchronous events when they were known to have happened. The hypothesis that the arrival of primates and hystricognaths to the New World consisted of a unique event cannot be rejected.
Keywords: South America; biogeography; eocene; oligocene; relaxed molecular clock.
Figures
References
-
- Platnick NI, Nelson G. Method of analysis for historical biogeography. Systematic Zoology. 1978;27:1–16.
-
- Rosen DE. Vicariant patterns and historical explanation in biogeography. Systematic Zoology. 1978;27:159–88.
-
- Nelson G, Platnick NI. Systematics and Biogeography: Cladistics and Vicariance. Columbia University Press; New York: 1981.
-
- Donoghue MJ, Moore BR. Toward an integrative historical biogeography. Integrative and Comparative Biology. 2003;43:261–70. - PubMed
-
- Sanderson MJ. A nonparametric approach to estimating divergence times in the absence of rate constancy. Molecular Biology and Evolution. 1997;14:1218–31.
LinkOut - more resources
Full Text Sources
