. 2011;11(1):719-42.
doi: 10.3390/s110100719. Epub 2011 Jan 12.

CAROLS: a new airborne L-band radiometer for ocean surface and land observations

Affiliations

CAROLS: a new airborne L-band radiometer for ocean surface and land observations

Mehrez Zribi et al. Sensors (Basel). 2011.

Abstract

The "Cooperative Airborne Radiometer for Ocean and Land Studies" (CAROLS) L-Band radiometer was designed and built as a copy of the EMIRAD II radiometer constructed by the Technical University of Denmark team. It is a fully polarimetric and direct sampling correlation radiometer. It is installed on board a dedicated French ATR42 research aircraft, in conjunction with other airborne instruments (C-Band scatterometer-STORM, the GOLD-RTR GPS system, the infrared CIMEL radiometer and a visible wavelength camera). Following initial laboratory qualifications, three airborne campaigns involving 21 flights were carried out over South West France, the Valencia site and the Bay of Biscay (Atlantic Ocean) in 2007, 2008 and 2009, in coordination with in situ field campaigns. In order to validate the CAROLS data, various aircraft flight patterns and maneuvers were implemented, including straight horizontal flights, circular flights, wing and nose wags over the ocean. Analysis of the first two campaigns in 2007 and 2008 leads us to improve the CAROLS radiometer regarding isolation between channels and filter bandwidth. After implementation of these improvements, results show that the instrument is conforming to specification and is a useful tool for Soil Moisture and Ocean Salinity (SMOS) satellite validation as well as for specific studies on surface soil moisture or ocean salinity.

Keywords: CAROLS; L band; SMOS; ocean salinity; radiometer; soil moisture.


Figures

Figure 1.
Figure 1.
Block diagram of the antenna and receiver unit.
Figure 2.
Figure 2.
The CAROLS radiometer inside the ATR42 research aircraft, (a) illustration of nadir antenna inside the aircraft, (b) illustration of CAROLS system (receiver and antennas) inside the aircraft.
Figure 3.
Figure 3.
Radiometric resolution of the CAROLS radiometer.
Figure 4.
Figure 4.
Illustration of CAROLS receiver linearity.
Figure 5.
Figure 5.
Stability of the CAROLS measurements. Non corrected data correspond to one calibration point; corrected data correspond to two calibration points before and after data acquisition.
Figure 6.
Figure 6.
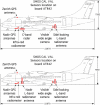
a. (top) CAROLS instrument with one slant antenna and the STORM instrument, b. (bottom) CAROLS instrument with two antennas (one slant and one nadir).
Figure 7.
Figure 7.
Illustration of flight transects, a (top) illustration of one ocean flight transect over the Gulf of Biscay, b (middle) Illustration of a SMOSMONIA flight transect. Markers are pointing to the location of the 12 SMOSMANIA measurement sites, c (bottom) Illustration of a Valencia transect flight.
Figure 8.
Figure 8.
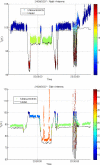
Measurements (8 ms average) recorded at the Y port (close to H-pol), by the nadir (top) and side (bottom) antennas on 24 September 2007. Incidence angles are indicated by the color coding. The simulated values of Ty are indicated by the black line.
Figure 9.
Figure 9.
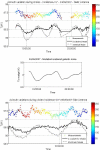
Top: Variations in Ty (1s averages) as observed (colored points), and simulated using the 2scale/DV2 (black) and SSA/Kudr. (grey) models during three circular flights. The azimuth angle is color coded. Bottom: Modeled variations of scattered galactic noise. Left: nadir antenna on 24/09/07; wind speed of 8.3 m/s. Right: side antenna on 28/09/07; wind speed of 8.4 m/s. (a bias has been artificially added to the measurements, to facilitate visual interpretation).
Figure 9.
Figure 9.
Top: Variations in Ty (1s averages) as observed (colored points), and simulated using the 2scale/DV2 (black) and SSA/Kudr. (grey) models during three circular flights. The azimuth angle is color coded. Bottom: Modeled variations of scattered galactic noise. Left: nadir antenna on 24/09/07; wind speed of 8.3 m/s. Right: side antenna on 28/09/07; wind speed of 8.4 m/s. (a bias has been artificially added to the measurements, to facilitate visual interpretation).
Figure 10.
Figure 10.
Variations in Ty (1 s averages) are observed (green) and simulated using either QSCAT wind speed values (red), or wind speed values derived from the STORM scatterometer (blue) on 28/11/07, along latitude 45.5°N. The low values observed at 3.7°W correspond to a change in direction of the aircraft.
Figure 11.
Figure 11.
Illustration of the data acquired during two CAROLS flights over the same transect, using the slant antenna, a (top) a flight in 2007, affected by strong RFI signals over land surfaces, b (bottom) a flight in 2008, after changes to the filter, showing a significant decrease in the percentage of RFI signals over land surfaces. The red points indicate the X polarization values, whereas the black ones indicate the Y polarization values (nearly corresponding to the V and H polarizations.
Figure 12.
Figure 12.
Comparison between measured and simulated antenna temperatures (in K)—for the Y (top) and X (bottom) polarizations, with the nadir antenna—as a function of view angle during the wing wag movements, for the three different flights (black: the first flight, red: the second flight, blue: the third flight) over the ocean during the CAROLS’2009 campaign.
Figure 13.
Figure 13.
Tb (K) measured for the X and Y polarizations, for both nadir (red) and slant (black) antennas, as a function of incidence angle.
Figure 14.
Figure 14.
T3 and T4 differences between modeled and measures values (Gulf of Biscay) during the 2009 CAROLS flights, for ±25° wing wags: nadir antenna (upper figures); slant antenna (lower figures).
Figure 15.
Figure 15.
Time variations of Tb during the SMOSMANIA transect, in 2009, for the nadir antenna (upper figure, red and black lines respectively for the X and Y polarizations), and slant antenna (lower figure, green and blue lines respectively for the X and Y polarizations). A mixed Kurtosis and thresholds to the Tb standard deviation algorithm [25] was applied for the data used here.

References

    1. Ulaby F.T., Moore R.K., Fung A.K. Microwave Remote Sensing. Artech House; Norwood, MA, USA: 1981.
    1. Skou N. Microwave Radiometer Systems: Design and Analysis. Artech House; Norwood, MA, USA: 1989.
    1. Le Vine D.M., Griffis A.J., Swift C.T., Jackson T.J. ESTAR: A Synthetic Aperture Microwave Radiometer for Remote sensing Applications. Proc. IEEE. 1994;82:1787–1801.
    1. Wilson W.J., Yueh S.H., Dinardo S.J., Chazanoff S.L., Kitiyakara A., Li K.F., Rahmat-Samii Y. Passive Active L- and S-Band (PALS) Microwave Sensor for Ocean Salinity and Soil Moisture Measurements. IEEE Trans. Geosci. Remote Sens. 2001;39:1039–1048.
    1. Lemaître F., Poussière J.K., Kerr Y.H., Déjus M., Durbe R., De Rosnay P., Calvet J.C. Design and Test of the Ground based L-Band Radiometer for Estimating Water in Soils (LEWIS) IEEE Trans. Geosci. Remote Sens. 2004;42:1666–1676.

Publication types

LinkOut - more resources