. 2011;11(11):10638-63.
doi: 10.3390/s111110638. Epub 2011 Nov 8.

Bio-sensing of cadmium(II) ions using Staphylococcus aureus

Affiliations

Bio-sensing of cadmium(II) ions using Staphylococcus aureus

Jiri Sochor et al. Sensors (Basel). 2011.

Abstract

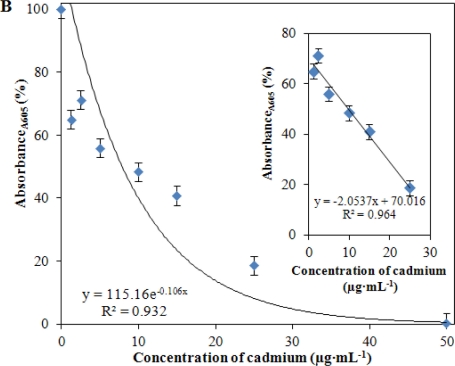
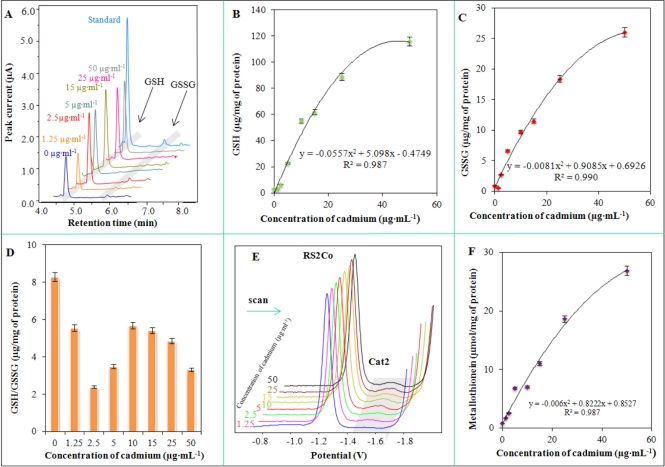
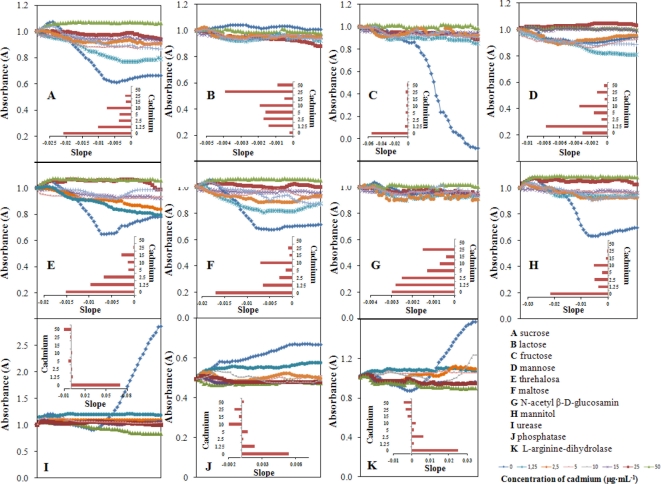
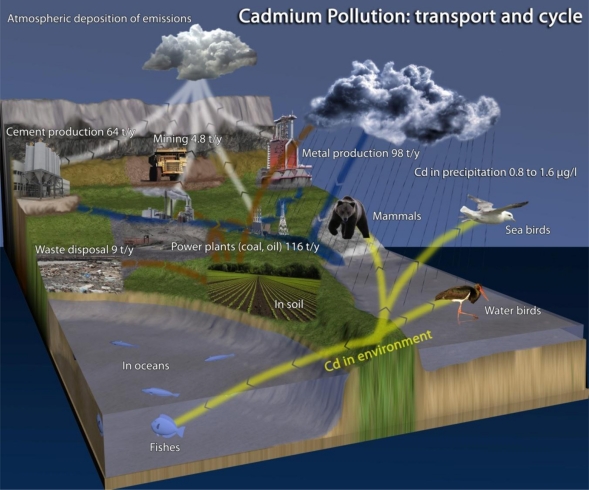
Cadmium, as a hazardous pollutant commonly present in the living environment, represents an important risk to human health due to its undesirable effects (oxidative stress, changes in activities of many enzymes, interactions with biomolecules including DNA and RNA) and consequent potential risk, making its detection very important. New and unique technological and biotechnological approaches for solving this problems are intensely sought. In this study, we used the commonly occurring potential pathogenic microorganism Staphylococcus aureus for the determination of markers which could be used for sensing of cadmium(II) ions. We were focused on monitoring the effects of different cadmium(II) ion concentrations (0, 1.25, 2.5, 5, 10, 15, 25 and 50 μg mL(-1)) on the growth and energetic metabolism of Staphylococcus aureus. Highly significant changes have been detected in the metabolism of thiol compounds-specifically the protein metallothionein (0.79-26.82 mmol/mg of protein), the enzyme glutathione S-transferase (190-5,827 μmol/min/mg of protein), and sulfhydryl groups (9.6-274.3 μmol cysteine/mg of protein). The ratio of reduced and oxidized glutathione indicated marked oxidative stress. In addition, dramatic changes in urease activity, which is connected with resistance of bacteria, were determined. Further, the effects of cadmium(II) ions on the metabolic pathways of arginine, β-glucosidase, phosphatase, N-acetyl β-d-glucosamine, sucrose, trehalose, mannitol, maltose, lactose, fructose and total proteins were demonstrated. A metabolomic profile of Staphylococcus aureus under cadmium(II) ion treatment conditions was completed seeking data about the possibility of cadmium(II) ion accumulation in cells. The results demonstrate potential in the application of microorganisms as modern biosensor systems based on biological components.

Keywords: Brdicka reaction; Staphylococcus aureus; biosensor; cadmium; electrochemistry; high performance liquid chromatography with electrochemical detection; metabolic activity; metabolome; microbiome; spectrophotometry; voltammetry.


Figures

Figure 1.
Figure 1.
Overview of bacteria cadmium interaction. (A) Cd(II) ions occur in environment (soil, water, biota); (B) Sorption of Cd(II) on the surface of bacterial wall (protein, cyrbohydrates); (C) ion transporter (metal transporting system—MIT, which enable Cd(II) to enter cell; (D) Efflux transporter: CadCA protein, which is a P-type ATPase; (E) Slow efflux is catalysed by cation-diffusion facilitator CDF; (F) Intracellular sequestration: Smt metallothionein locus on bacterial chromosome transcript and translate metallothionein, which binds Cd(II) and, thus, protects a cells against adverse effects of these ions; (G) cadCA cadmium resistance operon in Staphylococcus aureus on plasmid transcript and translate CadCA (D). (G) Export of chelating compounds (organic acids), which interact with Cd(II) ions directly in outer space to form complexes, which can not enter the cell. Scheme was adopted and modified according to the following papers [11,13,19].
Figure 2.
Figure 2.
(A) Dependencies of peak height of cadmium(II) ions on their concentrations measured in the presence of acetate buffer pH 4, 5 and 6; (B) Mathematical modelling of cadmium(II) ions behaviour in the presence of 0.2 M acetate buffer, pH 5; (C) Changes in the peak height of cadmium(II) ions measured in the presence of 0, 10, 50, 90 and 100% (v/v) of cultivation medium in supporting electrolyte. Changes in (upper inset) potentials of the peaks and (upper inset) linear slopes with the increasing content of cultivation medium in supporting electrolyte as 0.2 M acetate buffer, pH 5. Differential pulse voltammetric measurements were carried out under the following parameters: deoxygenating with argon 90 s; deposition potential −0.8 V; time of deposition 240 s; start potential −0.8 V; end potential 0.15 V; pulse amplitude 0.025 V; pulse time 0.04 s; step potential 5.035 mV; time of step potential 0.4 s.
Figure 3.
Figure 3.
(A) Dependence of free Cd(II) content in cultivation medium on the applied concentration of cadmium(II) ions; green columns represent ratio as follows—(determined content of Cd(II)/given content of Cd(II)) × 100; (B) Free Cd(II) content in bacteria cells; (C) Content of bound Cd(II) in bacteria cells; in inset: correlation between free and bound Cd(II) content. Ratios between medium Cd(II) content, and bound and free Cd(II) content in bacterial cell (D). Other experimental conditions are given in Figure 2.
Figure 4.
Figure 4.
Spectrophotometric analysis of cadmium(II) ions treated Staphylococcus aureus. (A) Dependencies of growth of bacteria on the applied concentration of cadmium(II) ions (0, 1.25, 2.5, 5, 10, 15, 25 and 50 μg·mL−1) monitored for 24 h. At the beginning of the experiment bacterial culture growing for 24 h was used. From this bacterial culture, starting culture with OD 0.1 (104 cells per mL) was prepared; (B) The growth of cadmium(II) ions treated bacterial cells expressed as OD (absorbance measured at 605 nm) measured at the end of the treatment; in inset: the dependence obtained within the concentration range from 0 to 30 μg of Cd(II) per mL. Growth of the cultures was determined fully automatically for 24 h at 37 °C without shaking of each culture (n = 3).
Figure 4.
Figure 4.
Spectrophotometric analysis of cadmium(II) ions treated Staphylococcus aureus. (A) Dependencies of growth of bacteria on the applied concentration of cadmium(II) ions (0, 1.25, 2.5, 5, 10, 15, 25 and 50 μg·mL−1) monitored for 24 h. At the beginning of the experiment bacterial culture growing for 24 h was used. From this bacterial culture, starting culture with OD 0.1 (104 cells per mL) was prepared; (B) The growth of cadmium(II) ions treated bacterial cells expressed as OD (absorbance measured at 605 nm) measured at the end of the treatment; in inset: the dependence obtained within the concentration range from 0 to 30 μg of Cd(II) per mL. Growth of the cultures was determined fully automatically for 24 h at 37 °C without shaking of each culture (n = 3).
Figure 5.
Figure 5.
(A) HPLC-ED chromatograms of cell lysates of S. aureus treated with cadmium(II) ions measured at 900 mV. Changes in the content of (B) GSH and (C) GSSG, and (D) GSH/GSSG ratio in cadmium(II) ion-treated S. aureus; (E) DP voltammograms of MT isolated from treated S. aureus; (F) Dependence of MT and MT-like proteins levels on the applied cadmium(II) ions concentration. Other experimental conditions are given in Figure 4 and in the Experimental section.
Figure 6.
Figure 6.
Spectrophotometric determination of (A) total proteins content by the Biuret method, (B) GST activity and (C) concentration of free –SH moieties; in inset: correlation between GST activity and free –SH moieties concentration. Other experimental conditions are given in Figure 4 and in the Experimental section.
Figure 7.
Figure 7.
Spectrophotometric detection of S. aureus metabolism through determination of (A) sucrose; (B) lactose; (C) fructose; (D) mannose; (E) threalose; (F) maltose; (G) N-acetyl β-d-glucosamine; (H) mannitol; (I) urease; (J) phosphatise; and (K) l-arginine-dihydrolase; in inset: slopes of the liner mathematical model. Other experimental conditions are given in Figure 4 and in the Experimental section.
Scheme 1.
Scheme 1.
Cadmium pollution—transport and cycle. Adapted according to UNEP Lead and Cadmium activities.

References

    1. Han F.X.X., Banin A., Su Y., Monts D.L., Plodinec M.J., Kingery W.L., Triplett G.E. Industrial age anthropogenic inputs of heavy metals into the pedosphere. Naturwissenschaften. 2002;89:497–504. - PubMed
    1. UNEP Lead (pb) and Cadmium (Cd) at the 26th Session of the Governing Council Nairobi 21 to 24 February 2011. Available online: http://www.unep.org/hazardoussubstances/LeadCadmium/ScientificReviews/Pr... (accessed on 16 September 2011).
    1. Agency for Toxic Substance and Disease Registry (ATSDR), US Toxicological Profile for Cadmium. Department of Health and Humans Services, Public Health Service, Centers for Disease Control; Atlanta, GA, USA: Available online: http://www.atsdr.cdc.gov/toxprofiles/tp5.pdf (accessed on 16 September 2011).
    1. Garrett R.G. Natural sources of metals to the environment. Hum. Ecol. Risk Assess. 2000;6:945–963.
    1. Johansson C., Norman M., Burman L. Road traffic emission factors for heavy metals. Atmos. Environ. 2009;43:4681–4688.

Publication types

MeSH terms

LinkOut - more resources