. 2009;9(7):5423-45.
doi: 10.3390/s90705423. Epub 2009 Jul 9.

Translocation Biosensors - Cellular System Integrators to Dissect CRM1-Dependent Nuclear Export by Chemicogenomics

Affiliations

Translocation Biosensors - Cellular System Integrators to Dissect CRM1-Dependent Nuclear Export by Chemicogenomics

Verena Fetz et al. Sensors (Basel). 2009.

Abstract

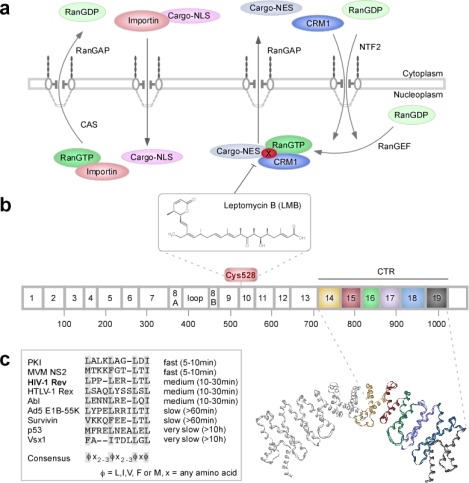
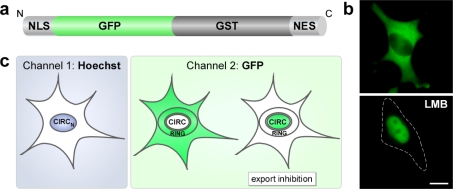
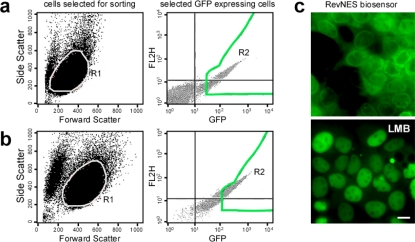
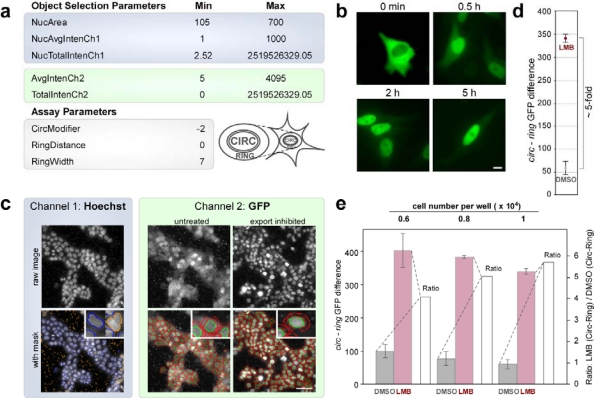
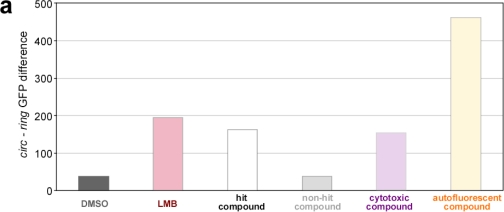
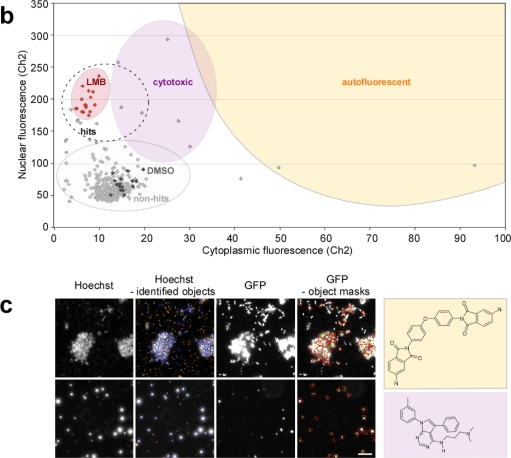
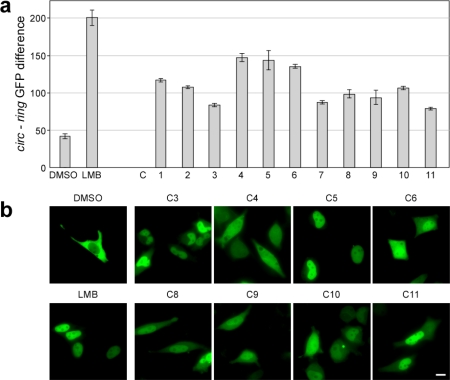
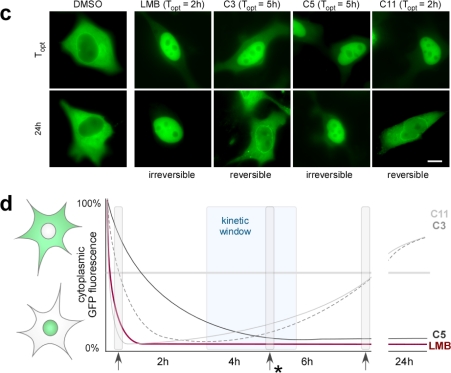
Fluorescent protein biosensors are powerful cellular systems biology tools for dissecting the complexity of cellular processes with high spatial and temporal resolution. As regulated nucleo-cytoplasmic transport is crucial for the modulation of numerous (patho)physiological cellular responses, a detailed understanding of its molecular mechanism would open up novel options for a rational manipulation of the cell. In contrast to genetic approaches, we here established and employed high-content cellular translocation biosensors applicable for dissecting nuclear export by chemicogenomics. A431 cell lines, stably expressing a translocation biosensor composed of glutathione S-transferase, GFP and a rational combination of nuclear import and export signals, were engineered by antibiotic selection and flow cytometry sorting. Using an optimized nuclear translocation algorithm, the translocation response could be robustly quantified on the Cellomics Arrayscan(®) VTI platform. Subsequent to assay optimization, the assay was developed into a higher density 384-well format high-content assay and employed for the screening of the 17K ChemBioNet compound collection. This library was selected on the basis of a genetic algorithm used to identify maximum common chemical substructures in a database of annotated bioactive molecules and hence, is well-placed in the chemical space covered by bioactive compounds. Automated multiparameter data analysis combined with visual inspection allowed us to identify and to rationally discriminate true export inhibitors from false positives, which included fluorescent compounds or cytotoxic substances that dramatically affected the cellular morphology. A total of 120 potential hit compounds were selected for Cellomics Arrayscan(®) VTI based rescreening. The export inhibitory activity of 20 compounds effective at concentrations < 25 μM were confirmed by fluorescence microscopy in several cell lines. Interestingly, kinetic analysis allowed the identification of inhibitors capable to interfere with the export receptor CRM1-mediated nuclear export not only in an irreversible, but also in a reversible fashion. In sum, exploitation of biosensor based screening allows the identification of chemicogenomic tools applicable for dissecting nucleo-cytoplasmic transport in living cells.

Keywords: Exportin 1/CRM1; HIV-1 Rev; LMB; cancer; chemical biology; import; nucleocytoplasmic transport; nucleoporin.


Figures

Figure 1.
Figure 1.
(a) Schematic illustration of the regulation of nucleo-cytoplasmic transport. As an example for nuclear export, the CRM1-dependent pathway is depicted. (b) Heat-repeat map of CRM1, which is predicted to contain 19 repeats separated by a loop within repeat 8. (c) Kinetic classification of NES sequences established by microinjection experiments of recombinant GST-NES-GFP substrates into the nucleus. Amino acids essential for function are highlighted in grey, putative consensus sequence for leucine-rich NES is shown below. (a) NLS-bearing cargoes are imported via binding to importins. In the nucleus, the importin-cargo complex dissociates upon RanGTP binding. CAS exports the respective importin back into the cytoplasm. RanGAP hydrolyses RanGTP to RanGDP resulting in release of the importin from CAS. Leucine-rich NES-bearing cargoes bind to CRM1 in the presence of RanGTP, and the complex translocates into the cytoplasm, where the cargo is released following hydrolysis of RanGTP to RanGDP. RanGDP is reimported by NTF2 and reconverted into RanGTP by RanGEF. Leptomycin B (LMB) inactivates CRM1 by covalent binding to Cys528, thereby irreversibly inhibiting NES-mediated nuclear export. For the selective export of cargoes, NES-specific cofactors (X) have been suggested. RanGEF - Ran guanine nucleotide exchange factor, RanGAP - Ran GTPase activating protein 1, NTF2 - Nuclear Transport Factor 2, CAS - cellular apoptosis susceptibility, X – putative NES-specific cofactor. (b) Heat repeat 10 contains the cysteine residue 528, which is covalently modified by LMB. The C-terminal region (CTR) comprises heat repeats 14 to 19, colored from yellow to black. The CTRs of two proteolytic fragments of CRM1 (residues 707–1027, PDB 1W9C) are displayed as a dimeric solid ribbon representation of the backbone superposition (heat repeats of one fragment colored as above).
Figure 2.
Figure 2.
(a) Schematic representation of the modular RevNES-biosensor. (b) In living HeLa cells transiently expressing the RevNES-biosensor, the protein localized predominantly to the cytoplasm, whereas treatment with LMB resulted in its nuclear accumulation. Scale bar, 10 μm. (c) Schematic illustration of the masks used to mark the nucleus and the cytoplasm in order to define the cytoplasmic to nuclear translocation of the autofluorescent biosensor (details see text).
Figure 3.
Figure 3.
Generation and characterization of RevNES-biosensor expressing cell lines. (a/b) A431 were transduced with pINCO_Rev-sensor containing retroviruses and subjected to two rounds of FACS sorting. A distinct cell population based on cell size (gate R1, left panels) and GFP fluorescence intensity (gate R2, right panel), was isolated. For the second round of FACS, only cells robustly expressing the RevNES biosensor were selected (b, R2 right panel). (c) Fluorescent microscopic images of the A431bio cell population isolated after two rounds of FACS. All cells showed a high expression of the RevNES-biosensor, which localized predominantly in the cytoplasm with some accumulation at the nuclear membrane (left panel). Treatment with LMB (10 nM; 2h) resulted in almost complete accumulation of the biosensor in living cells. Scale bar, 10 μm.
Figure 4.
Figure 4.
(a) Optimized object selection parameters (min/max settings) for channel 1 and 2 (highlighted in blue and green, respectively). (b) LMB treatment (10 nM) of A431bio cells resulted in a rapid nuclear accumulation of the biosensor already after 30 min, which remained stable also after 5 h without obvious cytotoxic effect on cell morphology. Scale bar, 10 μm. (c) Translocation assay analysis of A431bio cells using the Cellomics Arrayscan® VTI platform. The Hoechst and GFP signals were recorded in channel 1 and 2 (highlighted in blue and green), respectively, following LMB treatment (10 nM, 5 h). In the upper panel, the original raw images are shown. The lower panel shows the overlay with the respective masks. In channel 1, cells selected for further analysis are outlined in blue, cells rejected due to their size or shape are outlined in orange. In channel 2, the CIRC mask and RING region are outlined in green or red, respectively. Scale bar, 50 μm. (d) Average signal difference (CIRC-RING) of LMB treated cells (10 nM, 5 h) versus DMSO assay controls in one representative 384-well plate. 1 × 10⁴ cells/well were seeded, and the values were derived from analyzing ∼500 cells/well (see Table 1 for details) revealing a translocation index of > 5-fold. (e) Differences in assay performance depending on cell density. The indicated numbers of A431bio cells were seeded into 384-well plates. Sixteen h later, cells were treated with LMB (10 nM) or DMSO as a control for 5 h, and the translocation index quantitated using the Cellomics Arrayscan® VTI imager. CIRC-RING differences were plotted for DMSO control (grey) and LMB treated (red) cells (left scale). The ratio of these values (white columns) performed best for 1 × 10⁴ seeded cells/well. Columns, mean; bars, SD.
Figure 5.
Figure 5.
Intersection of the biological and chemical space. Translocation index-based analysis for cytotoxicity and fluorescence interference. (a) CIRC-RING values representative for negative and positive control substances (DMSO, LMB), export antagonists, substances showing no effect on export, cytotoxic and autofluorescent compounds obtained from the analysis of a representative 384-well plate. (b) Scatter plot of the nuclear intensity/well versus the cytoplasmic intensity/well in the “green” target channel 2 (GFP) subsequent to compound exposure to mark the intersection of the chemical and biological space. Values from a representative 384-well plate are shown. The DMSO controls (dark grey) are grouped together with the non-hit compounds (light grey), and are well separated from the LMB controls (red) and a potential hit population (black dotted circle). Potential hit compounds partially overlap with cytotoxic substances (violet), identified by visual inspection. Autofluorescent compounds (orange) usually display high fluorescence intensities and are well separated. (c) Representative images from compound wells that exhibited either a dose-dependent autofluorescence (upper panel) or a dose-dependent cytotoxicity (lower panel). Raw images and mask overlays are shown for both channels. In the Hoechst channel, objects selected for further analysis are outlined in blue, objects rejected are outlined in orange. In the “GFP channel”, the green outline represents the nuclear region mask, and the red outline the cytoplasmic ring region. Scale bar, 50 μm. The chemical structure of the respective compounds are shown on the right.
Figure 5.
Figure 5.
Intersection of the biological and chemical space. Translocation index-based analysis for cytotoxicity and fluorescence interference. (a) CIRC-RING values representative for negative and positive control substances (DMSO, LMB), export antagonists, substances showing no effect on export, cytotoxic and autofluorescent compounds obtained from the analysis of a representative 384-well plate. (b) Scatter plot of the nuclear intensity/well versus the cytoplasmic intensity/well in the “green” target channel 2 (GFP) subsequent to compound exposure to mark the intersection of the chemical and biological space. Values from a representative 384-well plate are shown. The DMSO controls (dark grey) are grouped together with the non-hit compounds (light grey), and are well separated from the LMB controls (red) and a potential hit population (black dotted circle). Potential hit compounds partially overlap with cytotoxic substances (violet), identified by visual inspection. Autofluorescent compounds (orange) usually display high fluorescence intensities and are well separated. (c) Representative images from compound wells that exhibited either a dose-dependent autofluorescence (upper panel) or a dose-dependent cytotoxicity (lower panel). Raw images and mask overlays are shown for both channels. In the Hoechst channel, objects selected for further analysis are outlined in blue, objects rejected are outlined in orange. In the “GFP channel”, the green outline represents the nuclear region mask, and the red outline the cytoplasmic ring region. Scale bar, 50 μm. The chemical structure of the respective compounds are shown on the right.
Figure 6.
Figure 6.
(a) Secondary ArrayScan®-based validation of potential export antagonists. 1 × 10⁴ A431bio cells/well were seeded into 384-well plates. 16 h later, cells were treated with LMB (10nM), DMSO or the indicated compounds (C1-C11; 25 μM) for 5 h, and translocation was quantitated using the Cellomics ArrayScan® VTI imager. The CIRC-RING differences are indicative of efficient export inhibition. Columns, mean; bars, SD. (b) In lab verification of hit compound performance in living HeLa cells transiently expressing the RevNES biosensor. Indicated compounds were applied at a concentration of 25 μM for 5 h, resulting in efficient nuclear accumulation of the biosensor. Scale bar, 10 μm. (c) Compound specific kinetics of inhibition. HeLa cells transiently expressing the RevNES biosensor were treated with LMB (10nM) or the indicated compounds (25 μM). The localization of the biosensor is shown at the indicated time points when the compounds displayed their maximum inhibitory activity (top panel), as well as 24 h post treatment. The inhibitory activity of C3 and C11 was reversed after 24 h. Scale bar, 10 μm. (d) Kinetic activity profile of export inhibitors. Selection of different time points (indicated by the arrows) for snapshot analysis (highlighted in grey) may significantly influence the number and type of compounds identified in primary screens. A continuous kinetic monitoring of the biosensor translocation may ensure the identification of the maximum number of bioactive substances and the optimal extraction of informations concerning their bioactivity. Time point used for analysis of the primary RevNES-biosensor screen is marked by the asterisks. An optimal kinetic window is highlighted in blue.
Figure 6.
Figure 6.
(a) Secondary ArrayScan®-based validation of potential export antagonists. 1 × 10⁴ A431bio cells/well were seeded into 384-well plates. 16 h later, cells were treated with LMB (10nM), DMSO or the indicated compounds (C1-C11; 25 μM) for 5 h, and translocation was quantitated using the Cellomics ArrayScan® VTI imager. The CIRC-RING differences are indicative of efficient export inhibition. Columns, mean; bars, SD. (b) In lab verification of hit compound performance in living HeLa cells transiently expressing the RevNES biosensor. Indicated compounds were applied at a concentration of 25 μM for 5 h, resulting in efficient nuclear accumulation of the biosensor. Scale bar, 10 μm. (c) Compound specific kinetics of inhibition. HeLa cells transiently expressing the RevNES biosensor were treated with LMB (10nM) or the indicated compounds (25 μM). The localization of the biosensor is shown at the indicated time points when the compounds displayed their maximum inhibitory activity (top panel), as well as 24 h post treatment. The inhibitory activity of C3 and C11 was reversed after 24 h. Scale bar, 10 μm. (d) Kinetic activity profile of export inhibitors. Selection of different time points (indicated by the arrows) for snapshot analysis (highlighted in grey) may significantly influence the number and type of compounds identified in primary screens. A continuous kinetic monitoring of the biosensor translocation may ensure the identification of the maximum number of bioactive substances and the optimal extraction of informations concerning their bioactivity. Time point used for analysis of the primary RevNES-biosensor screen is marked by the asterisks. An optimal kinetic window is highlighted in blue.
Figure 7.
Figure 7.
Model summarizing potential modes of action of the identified export inhibitors. Compounds may bind to CRM1 and, in an allosterical or competitive manner, affect its NES-binding domain, thereby preventing the assembly of a functional export complex. Alternatively, the compounds may directly interact with the specific NES itself or target putative cofactors required for the assembly of protein specific export complexes. Compounds displaying such a bioactivity profile would be of therapeutic interest.

Similar articles

Cited by

References

    1. Giuliano K.A., Johnston P.A., Gough A., Taylor D.L. Systems cell biology based on high-content screening. Methods Enzymol. 2006;414:601–619. - PubMed
    1. Sachs K., Perez O., Pe'er D., Lauffenburger D.A., Nolan G.P. Causal protein-signaling networks derived from multiparameter single-cell data. Science. 2005;308:523–529. - PubMed
    1. Knauer S.K., Moodt S., Berg T., Liebel U., Pepperkok R., Stauber R.H. Translocation biosensors to study signal-specific nucleo-cytoplasmic transport, protease activity and protein-protein interactions. Traffic. 2005;6:594–606. - PubMed
    1. Michael S., Auld D., Klumpp C., Jadhav A., Zheng W., Thorne N., Austin C.P., Inglese J., Simeonov A. A robotic platform for quantitative high-throughput screening. Assay Drug Dev. Technol. 2008;6:637–657. - PMC - PubMed
    1. Simpson P.B., Wafford K.A. New directions in kinetic high information content assays. Drug Discov. Today. 2006;11:237–244. - PubMed