. 2012 Feb;10(2):e1001258.
doi: 10.1371/journal.pbio.1001258. Epub 2012 Feb 7.

Genome-wide analysis of the world's sheep breeds reveals high levels of historic mixture and strong recent selection

Collaborators, Affiliations

Genome-wide analysis of the world's sheep breeds reveals high levels of historic mixture and strong recent selection

James W Kijas et al. PLoS Biol. 2012 Feb.

Abstract

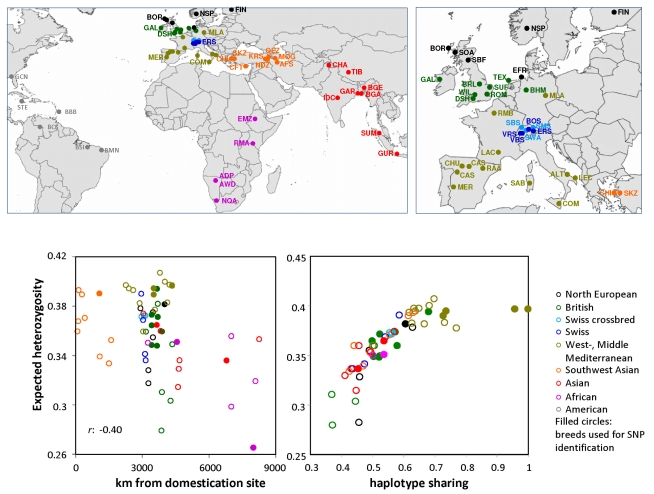
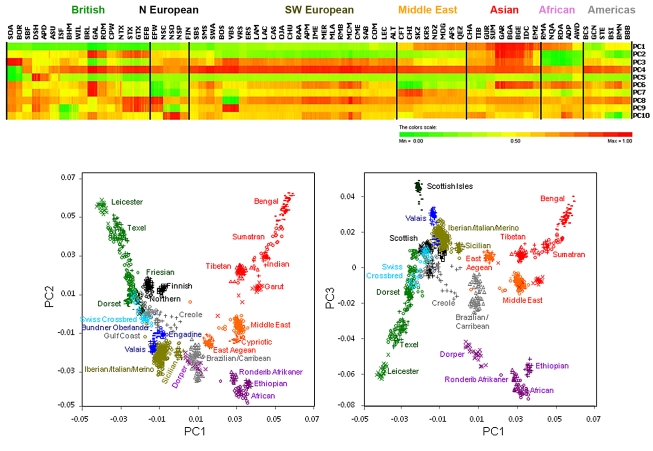
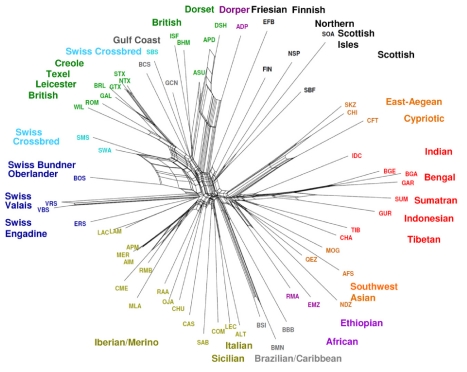
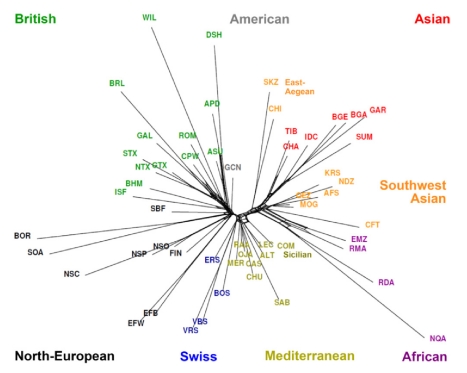
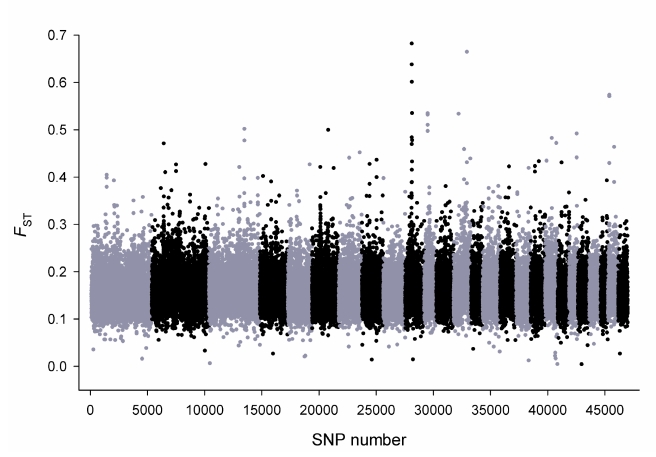
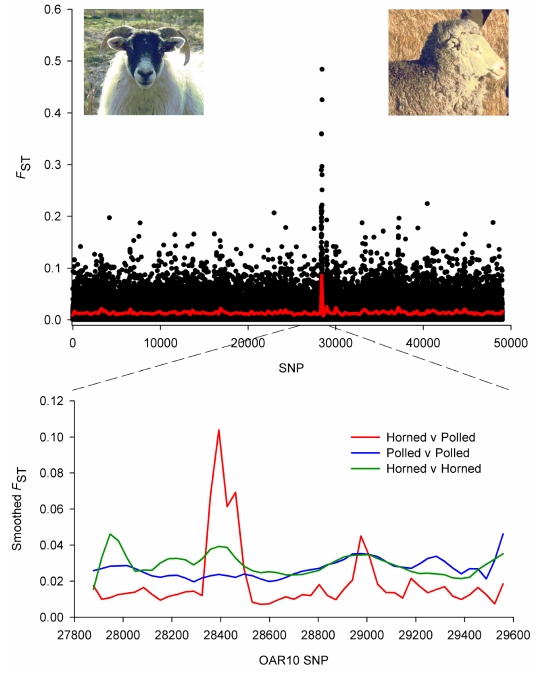
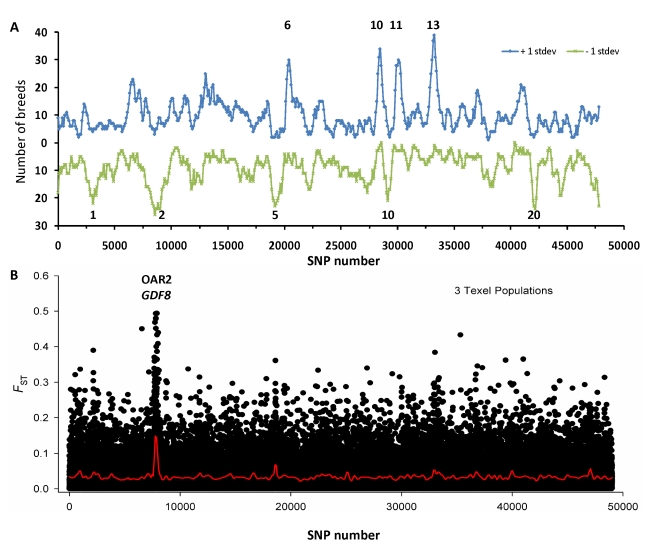
Through their domestication and subsequent selection, sheep have been adapted to thrive in a diverse range of environments. To characterise the genetic consequence of both domestication and selection, we genotyped 49,034 SNP in 2,819 animals from a diverse collection of 74 sheep breeds. We find the majority of sheep populations contain high SNP diversity and have retained an effective population size much higher than most cattle or dog breeds, suggesting domestication occurred from a broad genetic base. Extensive haplotype sharing and generally low divergence time between breeds reveal frequent genetic exchange has occurred during the development of modern breeds. A scan of the genome for selection signals revealed 31 regions containing genes for coat pigmentation, skeletal morphology, body size, growth, and reproduction. We demonstrate the strongest selection signal has occurred in response to breeding for the absence of horns. The high density map of genetic variability provides an in-depth view of the genetic history for this important livestock species.


Conflict of interest statement

The authors have declared that no competing interests exist.

Figures

Figure 1
Figure 1. Geographic origin of breed development and diversity.
Breeds were genotyped from the Americas, Africa, Asia, and the domestication centre in present-day Iran and Turkey (referred to throughout as South-West Asia). The majority of breeds genotyped were developed in Europe (given in detail at right). Breed names and their abbreviations are given in Table S1. Marker heterozygosity within each breed compared against increasing physical distance from the domestication centre. Breeds used during SNP discovery are shown using filled circles. Haplotype sharing at 25–50 Kb between Merinos and other breeds (Figure S8) was plotted against heterozygosity to reveal a major influence of Merino admixture on the genetic diversity of European breeds. Breed-specific values for expected heterozygosity and haplotype sharing are given in Table S4 to allow identification of populations with outlier values.
Figure 2
Figure 2. Population structure within the global sheep diversity panel.
Principal component (PC) analysis of genetic distance was performed using a subset of 20,279 SNP identified by LD-based SNP pruning. Heat strips for each of the first 10 PCs are shown for 74 breeds (top panel). The PC value for each animal was normalised to range from 0 to 1 and visualised as a colour spectrum from green (0) to red (1). Plots for PC1 and 2 (bottom left) and PC1 and 3 (bottom right) each revealed the clustering of 1,612 animals selected to balance the number of animals across breeds. Individuals are colour coded to represent their geographical origin.
Figure 3
Figure 3. Relationship between breeds based on divergence time.
The divergence time between breeds (in generations) estimated using LD was used to draw a NeighborNet graph. Reticulations towards the extremity of each graph indicate increasing genetic relatedness between populations. The divergence times are visualised as a heatmap in Figure S10.
Figure 4
Figure 4. Relationship between breeds based on Reynolds distance.
An allele frequency-dependent distance metric (Reynolds) was used to construct a NeighborNet graph relating breeds. As for Figure 3, reticulations towards the extremity of each graph indicate increasing genetic relatedness between populations.
Figure 5
Figure 5. Genome-wide distribution of global F ST.
The amount of differentiation, measured as F ST, was estimated within each breed by comparison to all other breeds. Global F ST is the average for each SNP across all 74 HapMap breeds, meaning common signals present in multiple breeds are preferentially detected. SNP were ordered in genomic order with OAR1 at left. The highest peak is on OAR10.
Figure 6
Figure 6. Selection for sheep without horns (poll).
Animals from two breeds with horns (Dorset Horn and Merino) were pooled and compared with two polled breeds (Poll Dorset and Poll Merino). Pairwise F ST was calculated between the two groups of animals for all 49,034 SNP, before smoothed values were plotted in order across the genome (top panel). A strong selection signal was observed on Chromosome 10 (SNP number 27,878–29,558 with the signal peak at SNP OAR10_29546872). Pairwise F ST was also calculated between horned breeds (green line) or between polled breeds (blue line) before the smoothed values were plotted across Chromosome 10 (bottom panel). The peak was only observed where horned breeds were compared with polled breeds, verifying that the signal relates to the long-standing husbandry practise of selecting animals for the absence of horns.
Figure 7
Figure 7. Common selection signals.
The number of breeds that showed divergent selection is shown as a function of genomic position (A). Selection peaks were defined as regions with smoothed F ST in excess of one standard deviation either above (positive selection; blue line) or below the genome-wide average (balancing selection; green line). Four regions were identified with shared positive selection peaks in 30 or more breeds (the chromosomal number is given above each peak). Similarly, five peaks were identified where 20 or more populations shared balancing selection, including the MHC region on OAR 20. One signal was common to each of three separate populations of Texel (B). Pairwise F ST was calculated between Texel and all other animals, which revealed a strong selection on sheep Chromosome 2 above the GDF8 gene, which underpins a breed defining phenotype.

References

    1. Zeder M. A. Domestication and early agriculture in the Mediterranean Basin: origins, diffusion, and impact. Proc Natl Acad Sci U S A. 2008;105:11597–11604. - PMC - PubMed
    1. Chessa B, Pereira F, Arnaud F, Amorim A, Goyache F, et al. Revealing the history of sheep domestication using retrovirus integrations. Science. 2009;324:532–536. - PMC - PubMed
    1. Meadows J. R, Li K, Kantanen J, Tapio M, Sipos W, Pardeshi V, et al. Mitochondrial sequence reveals high levels of gene flow between breeds of domestic sheep from Asia and Europe. J Hered. 2005;96:494–501. - PubMed
    1. Tapio M, Marzanov N, Ozerov M, Cinkulov M, Gonzarenko G, et al. Sheep mitochondrial DNA variation in European, Caucasian, and Central Asian areas. Mol Biol Evol. 2006;23:1776–1783. - PubMed
    1. Tapio M, Tapio I, Grislis Z, Holm L. E, Jeppsson S, et al. Native breeds demonstrate high contributions to the molecular variation in northern European sheep. Mol Ecol. 2005;14:3951–3963. - PubMed

Publication types