. 2012 Feb;8(2):e1002371.
doi: 10.1371/journal.pcbi.1002371. Epub 2012 Feb 9.

Multi-scale modeling of HIV infection in vitro and APOBEC3G-based anti-retroviral therapy

Affiliations

Multi-scale modeling of HIV infection in vitro and APOBEC3G-based anti-retroviral therapy

Iraj Hosseini et al. PLoS Comput Biol. 2012 Feb.

Abstract

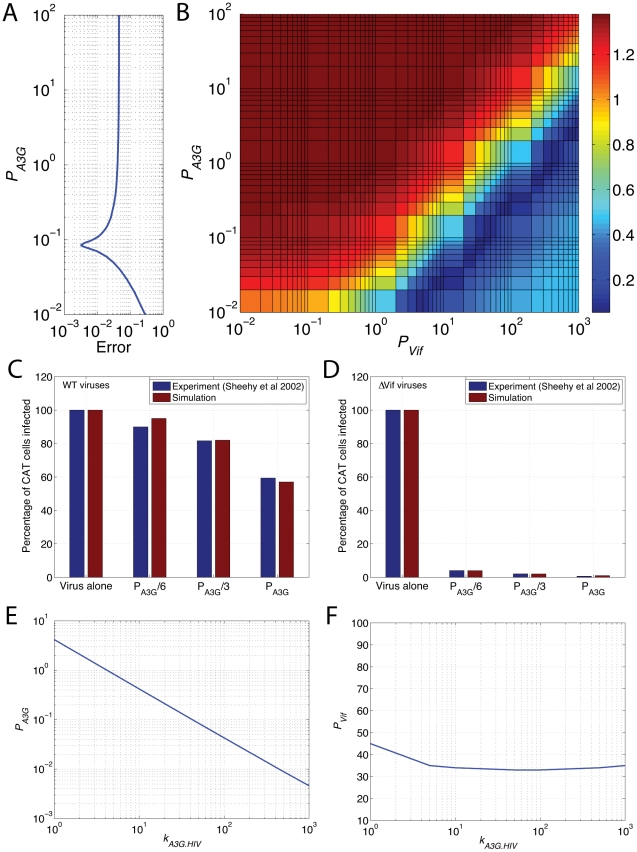
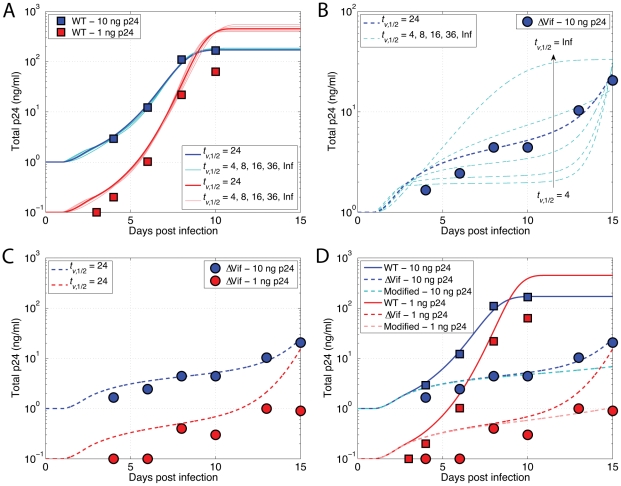
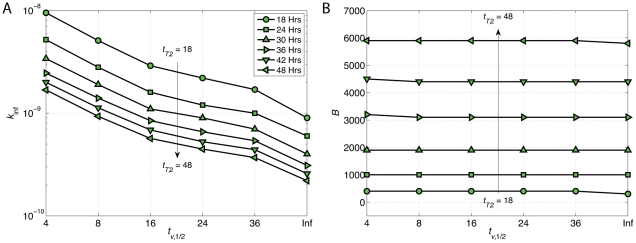
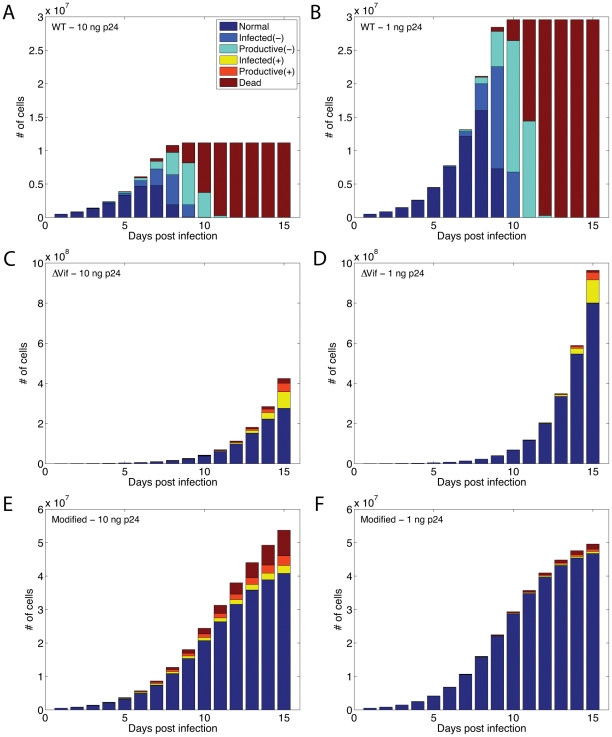
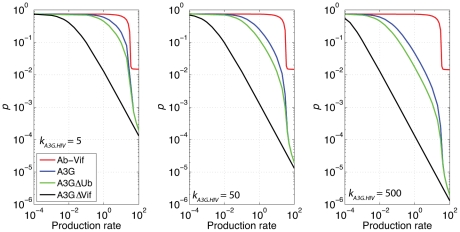
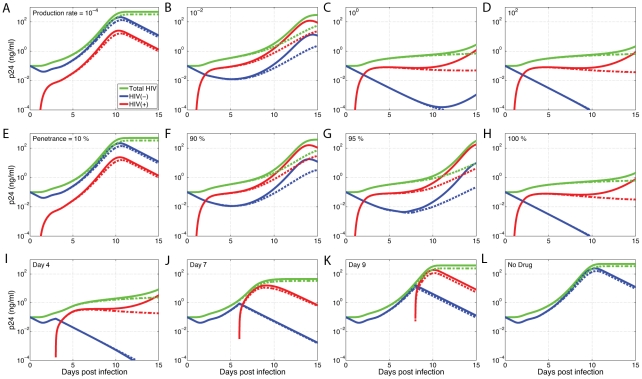
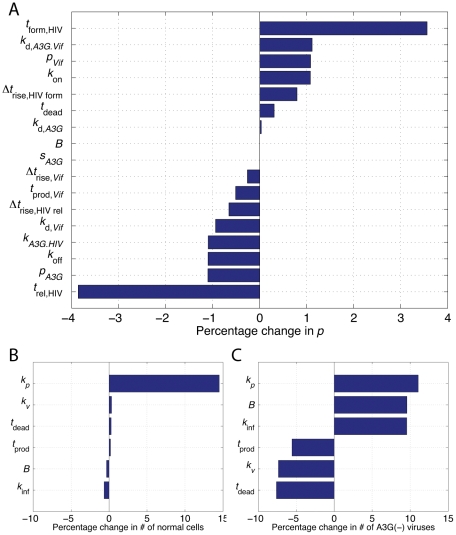
The human APOBEC3G is an innate restriction factor that, in the absence of Vif, restricts HIV-1 replication by inducing excessive deamination of cytidine residues in nascent reverse transcripts and inhibiting reverse transcription and integration. To shed light on impact of A3G-Vif interactions on HIV replication, we developed a multi-scale computational system consisting of intracellular (single-cell), cellular and extracellular (multicellular) events by using ordinary differential equations. The single-cell model describes molecular-level events within individual cells (such as production and degradation of host and viral proteins, and assembly and release of new virions), whereas the multicellular model describes the viral dynamics and multiple cycles of infection within a population of cells. We estimated the model parameters either directly from previously published experimental data or by running simulations to find the optimum values. We validated our integrated model by reproducing the results of in vitro T cell culture experiments. Crucially, both downstream effects of A3G (hypermutation and reduction of viral burst size) were necessary to replicate the experimental results in silico. We also used the model to study anti-HIV capability of several possible therapeutic strategies including: an antibody to Vif; upregulation of A3G; and mutated forms of A3G. According to our simulations, A3G with a mutated Vif binding site is predicted to be significantly more effective than other molecules at the same dose. Ultimately, we performed sensitivity analysis to identify important model parameters. The results showed that the timing of particle formation and virus release had the highest impacts on HIV replication. The model also predicted that the degradation of A3G by Vif is not a crucial step in HIV pathogenesis.


Conflict of interest statement

The authors have declared that no competing interests exist.

Figures

Figure 1
Figure 1. APOBEC3G 3D model structure, HIV virion and its life cycle.
(A) 3D model structure of A3G proposed by Zhang et al. . The 124–127 motif (red) is located beside the 128–130 Vif-binding region (green). (B) HIV particles are surrounded by fatty materials known as the viral envelope. The matrix formed from p17 protein is another layer underneath the viral envelope. The particles also contain two exact copies of RNA strands as well as three essential enzymes required for replication: reverse transcriptase, integrase and protease. (C) Mechanism of HIV infection including viral entry, genome integration, production and release of new viral particles, and encapsulation of A3G into virions is schematically shown. If the released viruses carry A3G, they are denoted A3G(+) viruses, otherwise they are denoted A3G(−). When A3G(+) viruses infect the next cell, the packaged A3G has several activities such as hypermutating the minus strand of viral DNA, and inhibiting various steps of reverse transcription and integration. “Null” symbols inside the cell represent degradation of Vif, A3G, and A3G-Vif complex.
Figure 2
Figure 2. Time-dependent profile of virus release from a single cell.
The time evolution of total number of A3G(−) and A3G(+) viruses produced inside a single cell and released from it is shown. Infection occurs at t = 0. Production of new viruses begins approximately 16 hours after infection. Light and dark green colors represent A3G(−) and A3G(+) viruses inside the cell. Newly produced viruses get released to the extracellular environment at 22 hours post infection and the virus release continues until the cell dies approximately 55 hours after infection. A3G(−) and A3G(+) viruses outside the cell are represented by light and dark brown colors.
Figure 3
Figure 3. A schematic diagram of cell states and a snapshot of the multicellular model.
(A) each cell lives in the “Normal” state until a HIV virus infects it. An “Infected” cell doesn't release new virions until a certain time point post infection, denoted t prod. At this time point, the cell becomes “Productive” and begins releasing viruses into the extracellular environment until it dies at t dead, when it is marked as “Dead”. The “Infected(+)” and “Infected(−)” states correspond to cells that have been infected by A3G(+) and A3G(−) viruses, respectively. The same concept applies to “Productive(+)” and “Productive(−)” cells. (B) The time of infection is known for each cell in our multicellular model. A snapshot of the multicellular model shows cells with different post-infection ages in the sets of infected and productive cells. Normal cells become infected and enter the set of infected cells as early-infected cells. The late-infected cells become productive and leave the set of infected cells to join the set of productive cells where they are shown as early-productive cells. Finally, late-productive cells die, exit the set of productive cells, and get marked as dead.
Figure 4
Figure 4. Degradation profile of protein entities in the model.
Using experimental data and first-order decay curves, degradation coefficients of (A) Vif, (B) A3G, and (C) A3G-Vif complex were estimated to be 0.25 hr−1, 0.1 hr−1, and 0.3 hr−1, respectively (re-plotted from Benedict et al. [60]).
Figure 5
Figure 5. Estimation of A3G and Vif production rates.
(A) shows the optimum PA3G for the ΔVif case (PVif = 0), whereas (B) shows the fitness error heat-map for a wide range of values of (PVif, PA3G) for the WT case. The error decreases as color changes from dark red to dark blue. The optimum PA3G can be read from (A) and projected to the dark blue region of (B) to find the optimum PVif. The experimental data from Sheehy et al. were used for estimating PVif and PA3G is re-plotted as blue bars for (C) WT and (D) ΔVif viruses. The red bars show our predictions of percentage of CAT cells infected by using estimated PA3G and PVif in our simulations. All the results in (A) and (B) are obtained for kA3G.HIV = 50 µM−1/hr. The optimum values of (E) PVif and (F) PA3G versus kA3G.HIV are also shown.
Figure 6
Figure 6. HIV growth curves for WT and ΔVif viruses.
(A) Inoculation of cultures of 500,000 cells with WT HIV. Blue and red squares represent 1 and 10 ng p24 HIV input, respectively. For a given tv ,1/2, values of burst size and virus infectivity rate were estimated such that the resulting simulated HIV growth curve fitted the blue data point with the minimum fitness error (shown as blue lines for tv ,1/2 = 4, 8, 16, 24, 26, Inf hours). Then, the estimated numbers were used to predict experimental data points corresponding to 1 ng p24 (shown as red lines). (B) Inoculation by 10 ng p24 ΔVif HIV. For each triplet of (tv ,1/2, B, k inf) from (A), the values of p and c between 0 and 1 were chosen such that the generated curve provided the smallest error. None of the values of tv ,1/2 produced good fits to the blue circles except tv ,1/2 = 24 hours where p and c were estimated to be 0.008 and 0.008, respectively. (C) The estimated parameters for tv ,1/2 = 24 hours from (A) and (B) were used to examine how well they could generate a curve to fit experimental data points corresponding to 1 ng p24 ΔVif input (red circles). The red dashed line provided an acceptable fit to the data points except for the last circle where the line diverged. (D) All the experimental data points as well as their HIV growth curves are shown in red and blue colors corresponding to 1 and 10 ng p24 HIV input. Also, we included crowding effects in our simulation by using a logistic function. The two new curves drawn in light red (1 ng p24 ΔVif) and light blue (10 ng p24 ΔVif) show the HIV growth curves for this case. It can be seen that these curves provide a better fit to the experimental data than the curves in (C).
Figure 7
Figure 7. Effects of HIV half-life and cell doubling time on virus infectivity rate and burst size.
(A) k inf decreases as tT ,2 changes from 18 to 48 hours. The same trend is also observed as tv ,1/2 increases from 4 hours to infinity. (B) Estimated burst size remains almost the same for different values of tv ,1/2, however, it increases as tT ,2 goes up.
Figure 8
Figure 8. Distribution of cell states during the period of post infection.
We simulated cultures of 500,000 healthy normal cells inoculated by either (A) 10 ng p24 or (B) 1 ng p24 WT HIV input. The infected cells start producing new virions after 22 hours and eventually die around 55 hours after infection. For WT HIV input, most of the cells are dead by the 12th day. In contrast, if we inoculate the cultures with either (C) 10 ng p24 or (D) 1 ng p24 ΔVif viruses, the healthy cells will still be the majority ones and the number of dead cells is negligible on the 15th day. In a different scenario, we included effects of cell culture crowding in our multicellular model by using a logistic function. Such cultures inoculated with either (E) 10 ng p24 or (F) 1 ng p24 ΔVif viruses provide better fits to biological experiments.
Figure 9
Figure 9. Efficacy comparison of several drugs for different production rates.
Efficacy of several proposed therapeutic proteins in reducing the parameter p estimated using the single-cell model for (A) kA3G.HIV = 5, (B) 50 and (C) 500 µM−1/hr. For all cases, A3GΔVif shows a better performance than other drugs.
Figure 10
Figure 10. Effects of different production rates, penetrances and administration times of A3GΔVif on HIV growth curve.
In all the simulations, 500,000 cells were inoculated by 1 ng 24 WT HIV input. (A–D) A3GΔVif with different production rates were administered right after inoculation. The red and blue lines represent A3G(−) and A3G(+) viruses in the culture, respectively. The green lines characterize all the viruses including A3G(−), A3G(+), and dead ones. For PA3GΔVif = 102, the amount of A3G(−) viruses decay to 10−4 ng p24/ml by the 10th day, however, the number of A3G(+) viruses rises on the 12th day. Dashed lines represent cultures with constrained proliferation (crowding effects modeled by using a logistic function). In this case, it is seen that A3G(+) viruses reach a stable level below 10−1 ng p24/ml and decrease very slowly up to the 15th day for PA3GΔVif = 102. This suggests that A3GΔVif has been able to stop HIV replication. (E–H) Effects of drug penetrance on HIV growth curves. We simulated cases where the drug was only available to a fraction of cells (PA3GΔVif = 102). Comparing cases corresponding to 95% and 100%, we can see that there is a gap larger than two orders of magnitude between the total levels of p24 on the 15th day. This implies that drugs should be available to all the cells to get the desired efficacy. The same qualitative effect is observed in the cultures with constrained proliferation for different drug penetrances. (I–L) Effects of administration time on HIV growth curves (PA3GΔVif = 102 and penetrance = 100%). It is seen that administering drug on the 9th day is not effective and the results are similar to the case of no drug. However, if the drug is administered before the 7th day, cell could still survive. The same trend in effects of drug administration time is also observed in cultures with constrained proliferation.
Figure 11
Figure 11. Sensitivity analysis in single-cell and multicellular models.
(A) The values of all 17 parameters in the intracellular model have changed by +5% and the percentage change in p for each of them is shown. Two parameters representing the time origins of virus release and particle formation had the highest impact on p. In contrast, parameters such as burst size, the degradation rate of A3G, and the stoichiometry of A3G proteins incorporated in HIV particles had zero or negligible effects on p. For the extracellular model, the effects of parameter variations were studied on two outputs; (B) number of normal cells and (C) number of A3G(−) viruses on the 6th day. In both cases, variations of cells proliferation rate had the highest impact on the extracellular model outputs.

Similar articles

Cited by

References

    1. Chiu YL, Greene WC. The APOBEC3 cytidine deaminases: an innate defensive network opposing exogenous retroviruses and endogenous retroelements. Annu Rev Immunol. 2008;26:317–353. - PubMed
    1. Malim MH. APOBEC proteins and intrinsic resistance to HIV-1 infection. Philos Trans R Soc Lond B Biol Sci. 2009;364:675–687. - PMC - PubMed
    1. Goila-Gaur R, Strebel K. HIV-1 Vif, APOBEC, and Intrinsic Immunity. Retrovirology. 2008;5:51. - PMC - PubMed
    1. Albin JS, Harris RS. Interactions of host APOBEC3 restriction factors with HIV-1 in vivo: implications for therapeutics. Expert Rev Mol Med. 2010;12:e4. - PMC - PubMed
    1. Strebel K, Luban J, Jeang K-T. Human cellular restriction factors that target HIV-1 replication. BMC Med. 2009;7:48. - PMC - PubMed

Publication types

MeSH terms

Substances