. 2012 Feb;8(2):e1002511.
doi: 10.1371/journal.pgen.1002511. Epub 2012 Feb 9.

Ultrafast evolution and loss of CRISPRs following a host shift in a novel wildlife pathogen, Mycoplasma gallisepticum

Affiliations

Ultrafast evolution and loss of CRISPRs following a host shift in a novel wildlife pathogen, Mycoplasma gallisepticum

Nigel F Delaney et al. PLoS Genet. 2012 Feb.

Erratum in

  • PLoS Genet. 2012 Mar;8(3). doi: 10.1371/annotation/b5608bc6-aa54-40a7-b246-51fa7bc4a9db

Abstract

Measureable rates of genome evolution are well documented in human pathogens but are less well understood in bacterial pathogens in the wild, particularly during and after host switches. Mycoplasma gallisepticum (MG) is a pathogenic bacterium that has evolved predominantly in poultry and recently jumped to wild house finches (Carpodacus mexicanus), a common North American songbird. For the first time we characterize the genome and measure rates of genome evolution in House Finch isolates of MG, as well as in poultry outgroups. Using whole-genome sequences of 12 House Finch isolates across a 13-year serial sample and an additional four newly sequenced poultry strains, we estimate a nucleotide diversity in House Finch isolates of only ∼2% of ancestral poultry strains and a nucleotide substitution rate of 0.8-1.2×10(-5) per site per year both in poultry and in House Finches, an exceptionally fast rate rivaling some of the highest estimates reported thus far for bacteria. We also found high diversity and complete turnover of CRISPR arrays in poultry MG strains prior to the switch to the House Finch host, but after the invasion of House Finches there is progressive loss of CRISPR repeat diversity, and recruitment of novel CRISPR repeats ceases. Recent (2007) House Finch MG strains retain only ∼50% of the CRISPR repertoire founding (1994-95) strains and have lost the CRISPR-associated genes required for CRISPR function. Our results suggest that genome evolution in bacterial pathogens of wild birds can be extremely rapid and in this case is accompanied by apparent functional loss of CRISPRs.


Conflict of interest statement

The authors have declared that no competing interests exist.

Figures
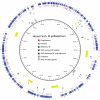
Figure 1
Figure 1. Overview of the genome of the House Finch strain of Mycoplasma gallisepticum summarizing variation among 12 House Finch MG isolates and comparing these to a poultry reference (0.99 Mb).
Blue ticks indicate SNPs fixed within the House Finch isolates and differing from the chicken MG reference. Red ticks indicate polymorphisms among the House Finch isolates. Yellow regions are unassembled repetitive regions including VlhA and AprE genes. Grey regions indicate 4.8% of the aligned genome that is deleted in the House Finch isolates; numbers correspond to deletions detailed in Table S12. Green and light blue ticks indicate IS elements (family IS1634) in the reference genome and novel sites in the House Finch strains, respectively; letters next to novel sites correspond to insertions detailed in Table S9.
Figure 2
Figure 2. Patterns of polymorphism among Mycoplasma gallisepticum isolates collected from House Finches.
a) Comparison of nucleotide diversity between historical chicken MG strains and serially sampled House Finch MG isolates for a 1.3 kb region . b) Expansion of House Finch nucleotide diversity measured across the whole-genome alignment (approximately 738 kb when considering only the 12 House Finch isolates). c) Patterns of synonymous and nonsynonymous substitution for all MG isolates sequenced in this study as well as the reference. The values in this histogram reflect estimates of ω = d n/d s across a tree including all House Finch isolates and the poultry Rlow reference. For a full list of patterns of substitution for each gene, see Data S1 (Estimates of omega.xls). d) Bayesian skyline plot estimated from the alignment of 12 of house finch Mycoplasma strains. Although the upper and lower 95% confidence limits (gray lines) on the skyline plot are substantial, the overall trend (black line) is indicative of population growth approximately 17 years before 2007, or 1990, placing the spread of MG somewhat earlier than the first field observations in 1994. Note that time is reversed so that time proceeds from left (past) to right (most recent time of sampling).
Figure 3
Figure 3. Phylogeny of Mycoplasma gallisepticum isolates collected at time points 1994–2007 following a host shift from poultry to House Finches.
The basic topology and branch lengths of the tree come from the output for the BEAST analysis made while estimating evolutionary rates. From this tree we collapsed branches with less than 0.6 posterior probability or if there were no phylogenetically informative SNPs supporting that branch. Several strains are shown as polytomies because their genomic histories are shaped by recombination. Within the House Finch MG clade, branch lengths are proportional to time. Major genomic events are indicated on appropriate branches. The numbers of diagnostic SNPs indicated on various branches are minima. The numbers of CRISPR changes shown are only those that can be constructed with reasonable support (Figure 5); one possible reconstruction is presented.
Figure 4
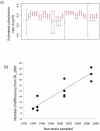
Figure 4. 95% highest posterior density intervals on the estimated substitution rate.
A) for House Finch Mycoplasma strains derived from 34 analyses using the different data and model combinations described in Text S2. The middle circle of each bar is the estimated mean; top and bottom circles are the upper and lower 95% bounds of each highest posterior density (HPDs). b) Root-to-tip graph of sampling date of House Finch Mycoplasma strains versus divergence from the closest sequence in the putative source population TK_2001. A simple regression gives an estimated substitution rate of 1.45×10⁻⁵, consistent with estimates from BEAST. See Text S2 and Text S7 for further information.
Figure 5
Figure 5. Evolution of the CRISPR locus in Mycoplasma gallisepticum isolates collected from House Finches, chickens, and turkeys.
Numbers by each strain indicate the number of repeats in each CRISPR array. The ancestral 71-repeat CRISPR array of the chicken MG strain is shown in simplified form at bottom. Diagnostic CRISPR repeats for House Finch MG isolates are indicated in repeat-specific patterns. The black ovals signify the cluster of four CRISP-associated (CAS) genes, which are deleted in the 2007 strains. The tree at left is broadly consistent with the tree based on SNPs (Figure 3) but emphasizes strain clusters indicated by rare genomic changes and CRISPR deletions; it was constructed as described in Text S3.

Similar articles

Cited by

References

    1. Fischer J, Stallknecht D, Luttrell P, Dhondt A, Converse K. Mycoplasmal conjunctivitis in wild songbirds: the spread of a new contagious disease in a mobile host population. Emerg Infect Diseases. 1997;3:69. - PMC - PubMed
    1. Nolan P, Hill G, Stoehr A. Sex, size, and plumage redness predict house finch survival in an epidemic. Proceedings of the Royal Society B-Biological Sciences. 1998;265:961.
    1. Dhondt AA, Dhondt KV, Hawley DM, Jennelle CS. Experimental evidence for transmission of Mycoplasma gallisepticum in house finches by fomites. Avian Pathol. 2007;36:205–208. - PubMed
    1. Dhondt AA, Tessglia DL, Slothower RL. Epidemic mycoplasmal conjunctivitis in House Finches from eastern North America. J Wildlife Dis. 1998;34:265–280. - PubMed
    1. Faustino C, Jennelle C, Connolly V, Davis A, Swarthout E, et al. Mycoplasma gallisepticum infection dynamics in a house finch population: seasonal variation in survival, encounter and transmission rate. Ecology. 2004;73:651–669.

Publication types