. 2012 Feb 2:6:3.
doi: 10.3389/fnana.2012.00003. eCollection 2012.

How the cortex gets its folds: an inside-out, connectivity-driven model for the scaling of Mammalian cortical folding

Affiliations

How the cortex gets its folds: an inside-out, connectivity-driven model for the scaling of Mammalian cortical folding

Bruno Mota et al. Front Neuroanat. .

Abstract

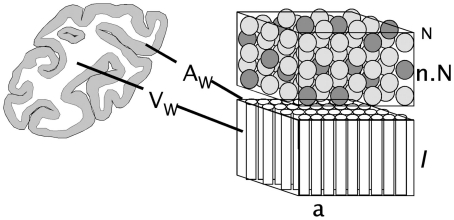
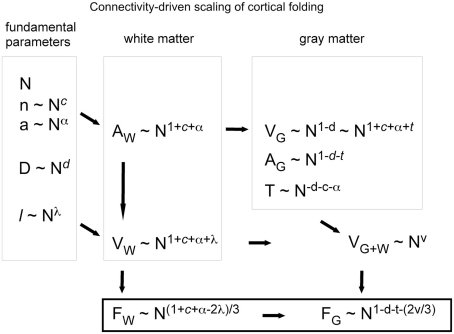
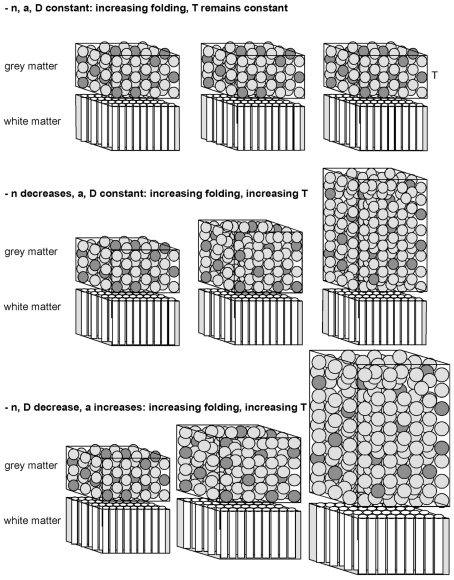
Larger mammalian cerebral cortices tend to have increasingly folded surfaces, often considered to result from the lateral expansion of the gray matter (GM), which, in a volume constrained by the cranium, causes mechanical compression that is relieved by inward folding of the white matter (WM), or to result from differential expansion of cortical layers. Across species, thinner cortices, presumably more pliable, would offer less resistance and hence become more folded than thicker cortices of a same size. However, such models do not acknowledge evidence in favor of a tension-based pull onto the GM from the inside, holding it in place even when the constraint imposed by the cranium is removed. Here we propose a testable, quantitative model of cortical folding driven by tension along the length of axons in the WM that assumes that connections through the WM are formed early in development, at the same time as the GM becomes folded, and considers that axonal connections through the WM generate tension that leads to inward folding of the WM surface, which pulls the GM surface inward. As an important necessary simplifying hypothesis, we assume that axons leaving or entering the WM do so approximately perpendicularly to the WM-GM interface. Cortical folding is thus driven by WM connectivity, and is a function of the fraction of cortical neurons connected through the WM, the average length, and the average cross-sectional area of the axons in the WM. Our model predicts that the different scaling of cortical folding across mammalian orders corresponds to different combinations of scaling of connectivity, axonal cross-sectional area, and tension along WM axons, instead of being a simple function of the number of GM neurons. Our model also explains variations in average cortical thickness as a result of the factors that lead to cortical folding, rather than as a determinant of folding; predicts that for a same tension, folding increases with connectivity through the WM and increased axonal cross-section; and that, for a same number of neurons, higher connectivity through the WM leads to a higher degree of folding as well as an on average thinner GM across species.

Keywords: allometry; axon caliber; brain size; connectivity; cortical folding; cortical thickness; evolution; white matter.


Figures

Figure 1
Figure 1
Schematic of the cortical layout used in the model. The two volumes on the right illustrate the cortical gray matter (top) and white matter (bottom). The gray matter is composed of an N number of neurons, a fraction n of which are connected through the white matter (darker gray), either sending or receiving axons (of an average cross-sectional area a) through it. Glial cells, which have been found to be distributed at a fairly constant density across species (Herculano-Houzel, 2011), are not shown. The surface area of the interface between the gray and white matter, AW, is given as the product nNa, and the volume of the white matter, VW, is proportional to the product of AW and the average axonal length in the white matter, l.
Figure 2
Figure 2
Schematic of our connectivity-driven model of the scaling of cortical folding with increasing numbers of cortical neurons (N). To the left are shown what we propose to be the fundamental parameters determining cortical folding, probably determined genetically, and which we postulate to vary alometrically with N: the fraction of cortical neurons connected through the gray matter (n), the average cross-sectional area of the axons in the white matter (a), the average neuronal density in the gray matter (D, which is approximately proportional to the inverse of average neuronal cell volume in the gray matter), and the average axonal length in the white matter (l). Next, white matter surface (AW) and volume (VW) are organized as shown, depending on N and the scaling exponents, and thus determine the folding of the white matter surface (FW). On top of AW, the gray matter becomes organized depending on the average size of its neurons, which, combined to a and n, determine cortical thickness, T. The degree of folding of the gray matter, FG, is thus a consequence of the folding of the white matter, which is in turn dependent on how the parameters determining cortical connectivity (c, a, and l) scale with N.
Figure 3
Figure 3
Schematics of various manners of cortical scaling (and folding, not shown) depending on the interplay between the scaling parameters and how they vary with the number of cortical neurons as it increases (left to right). In all three scenarios, axons in the white matter grow under enough tension to lead to cortical folding, fulfilling the condition that λ < (c + 1 + α)/2. In the top scenario, in which the connectivity fraction is unchanged (indicated by the dark gray “neurons” in the gray matter), c = α = 0; therefore λ < 0.5, and the cortex folds more and more with an unchanging thickness given that, in this scenario, d is also 0. In the middle scenario, in which the connectivity fraction decreases but α = d = 0, cortical folding will increase, with an accompanying increase in thickness that scales with Nc (from t = −cd−α). In the bottom scenario, in which the connectivity fraction decreases (c < 0) and both average neuronal size in the gray matter and axonal cross-sectional area in the white matter increase with N (that is, d < 0 and α > 0), cortical folding increases with a rapid increase in thickness that scales with Ncd−α.

Similar articles

Cited by

References

    1. Barres B. A., Raff M. C. (1994). Control of oligodendrocyte number in the developing rat optic nerve. Neuron 12, 935–94210.1016/0896-6273(94)90305-0 - DOI - PubMed
    1. Barres B. A., Raff M. C. (1999). Axonal control of oligodendrocyte development. J. Cell Biol. 147, 1123–112810.1083/jcb.147.6.1123 - DOI - PMC - PubMed
    1. Braitenberg V., Schüz A. (1998). Cortex: Statistics and Geometry of Neuronal Connectivity, 2nd Edn. Berlin: Springer Verlag
    1. Caminiti R., Ghaziri H., Galuske R., Hof P. R., Innocenti G. M. (2009). Evolution amplified processing with temporally dispersed slow neuronal connectivity in primates. Proc. Natl. Acad. Sci. U.S.A. 106, 19551–1955610.1073/pnas.0907655106 - DOI - PMC - PubMed
    1. Chenn A., Walsh C. (2002). Regulation of cerebral cortical size by control of cell cycle exit in neural precursos. Science 297, 365–36910.1126/science.1074192 - DOI - PubMed