. 2012 Feb 1:6:2.
doi: 10.3389/fnsys.2012.00002. eCollection 2012.

Tinnitus does not require macroscopic tonotopic map reorganization

Affiliations

Tinnitus does not require macroscopic tonotopic map reorganization

Dave R M Langers et al. Front Syst Neurosci. .

Abstract

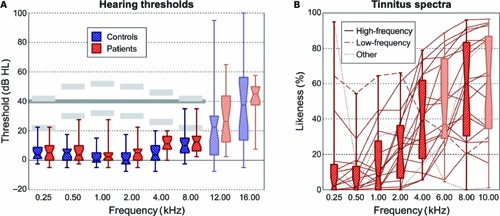
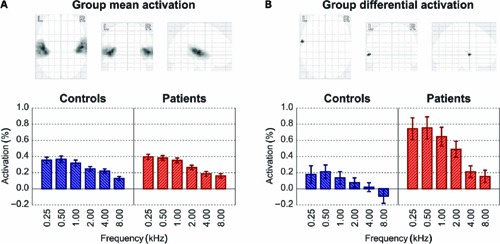
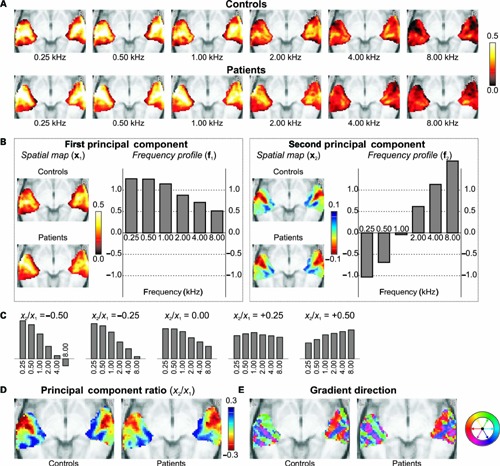
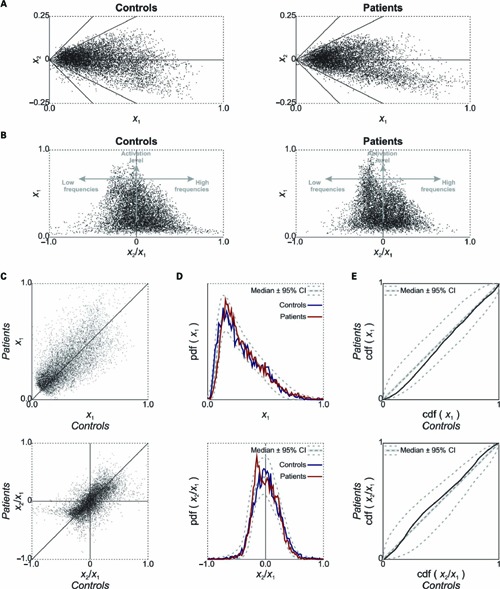
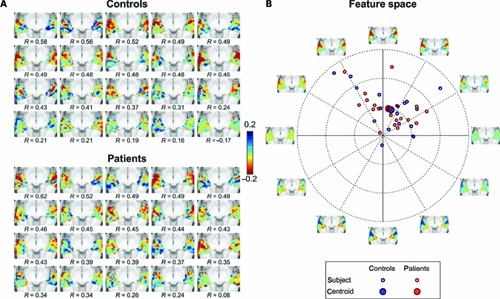
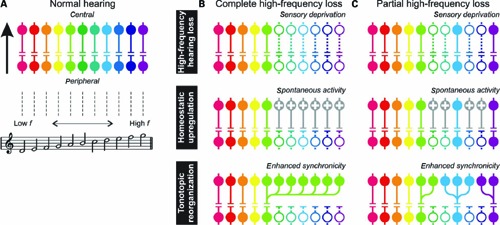
The pathophysiology underlying tinnitus, a hearing disorder characterized by the chronic perception of phantom sound, has been related to aberrant plastic reorganization of the central auditory system. More specifically, tinnitus is thought to involve changes in the tonotopic representation of sound. In the present study we used high-resolution functional magnetic resonance imaging to determine tonotopic maps in the auditory cortex of 20 patients with tinnitus but otherwise near-normal hearing, and compared these to equivalent outcomes from 20 healthy controls with matched hearing thresholds. Using a dedicated experimental paradigm and data-driven analysis techniques, multiple tonotopic gradients could be robustly distinguished in both hemispheres, arranged in a pattern consistent with previous findings. Yet, maps were not found to significantly differ between the two groups in any way. In particular, we found no evidence for an overrepresentation of high sound frequencies, matching the tinnitus pitch. A significant difference in evoked response magnitude was found near the low-frequency tonotopic endpoint on the lateral extreme of left Heschl's gyrus. Our results suggest that macroscopic tonotopic reorganization in the auditory cortex is not required for the emergence of tinnitus, and is not typical for tinnitus that accompanies normal hearing to mild hearing loss.

Keywords: auditory cortex; functional magnetic resonance imaging; humans; tinnitus; tonotopy.


Figures

FIGURE 1
FIGURE 1
(A) Hearing thresholds were measured at frequencies from 0.25 to 16.00 kHz. Results were averaged over both ears, and shown by means of boxplots (showing inter-quartile ranges). Stimuli were presented at all octave frequencies from 0.25 to 8.00 kHz at two different intensity levels that differed by 20 dB. The light gray bars indicate the approximate presentation levels. In the analysis, the sound-evoked activation levels were interpolated to a uniform intensity level of 40 dB HL, indicated by the dark gray line. (B) Patients performed a tinnitus spectrum test in which they indicated the subjective “likeness” to their tinnitus percept of a range of sound stimuli with varying center frequencies. The majority of subjects showed high-frequency tinnitus (solid; likeness increasing with frequency); one subject showed a low-frequency tinnitus (dashed; likeness decreasing with frequency); two subjects showed a spectrum that could not be classified as high- or low-frequency (dotted; with a peak or a dip at intermediate frequencies).
FIGURE 2
FIGURE 2
(A) Overall activation to all sound stimuli in the controls and patients combined (thresholded at p < 0.05, FWE-corrected, and minimum cluster size of 100 voxels) occurred in the bilateral auditory cortices. Below the glass brain display, the bar plot shows the activation to various frequencies (interpolated to 40 dB HL) for both subject groups separately. Error bars indicate standard errors of the mean across subjects. (B) Testing for any differences between groups in the frequency-dependent sound-evoked activation profile (thresholded at p < 0.05, FWE-corrected, and minimum cluster size of 20 voxels) revealed one cluster in left lateral Heschl’s gyrus. The bar plot shows the mean response levels for this subset of voxels.
FIGURE 3
FIGURE 3
(A) Mean intensity projections of the activation to all sound stimuli (interpolated to 40 dB HL) in the controls and patients separately. (B) A principal component decomposition of the frequency-dependent response profiles across all voxels and all subjects resulted in a first component that summarized the general activation levels, and a second component that reflected the frequency-selectivity that differed between voxels. (C) For various mixtures of the first and second principal components’ frequency response profiles, one may obtain response behaviors that range from low- to high-frequency tuning as the ratio of the coefficients x2/x1 increases from negative to positive values. (D) Spatial maps of the ratio x2/x1 reveal the tonotopic organization of the auditory cortices. (E) By color-coding the gradient direction of the maps in (D), multiple parallel strips of cortex are distinguishable.
FIGURE 4
FIGURE 4
(A) The coefficients in the first and second components’ spatial response maps (see Figure 3B) were plotted against each other. Each data point corresponds with one voxel. The diagonal lines show where the ratio x2/x1 remains constant. (B) Transforming the representation in (A), the ratio of the first and second components’ coefficients was plotted against the coefficient of the first component. The vertical coordinate of a voxel’s data point reflects its sound-evoked activation level, and the horizontal coordinate reflects its frequency tuning. (C) A plot of the sound-evoked activation level (top) and frequency tuning (bottom), as quantified by the value x1 and ratio x2/x1, respectively, comparing healthy controls and tinnitus patients. (D) The probability density function (pdf) of the value x1 (top) and ratio x2/x1 (bottom) is plotted in the form of a histogram. Dashed lines indicate the median and 95% confidence intervals as obtained from a bootstrap procedure. (E) The corresponding cumulative density function (cdf) in both groups are plotted against each other. Again, dashed lines indicate the bootstrap median and 95% confidence intervals.
FIGURE 5
FIGURE 5
(A) Individual spatial response maps of the second principal component x2 for all subjects in the two groups, arranged in order of decreasing similarity with the mean map of all subjects (as quantified by Pearson correlations R). (B) The detailed but complex representations in (A) were projected onto a two-dimensional feature space that still captured a maximal amount of variance by means of principal component analysis. Each subject is represented by a colored symbol at coordinates that reflect the loading on the two features.The axes are labeled with images that display the spatial response maps corresponding with the dimensions of the feature space, as are various mixtures along diagonals in between. The further from the origin, the more pronounced a feature is represented in a subject.
FIGURE 6
FIGURE 6
(A) A simplified diagram showing transmission of acoustic information from the peripheral to the central auditory system across multiple parallel channels.The colors represent frequency tuning. (B) After complete high-frequency hearing loss (top panel), sensory deprivation leads to permanently reduced activity in the affected channels (symbolized by dotted lines and open circles). Following homeostatic upregulation (middle panel), neurons with increased gain (indicated with plusses) respond even to low levels of spontaneous activity. Alternatively, following tonotopic reorganization (bottom panel), large numbers of neurons receive input from the edge-frequency region. (C) In the present study, high-frequency hearing thresholds were largely normal, suggesting that sufficient hair cells and neurons in the affected frequency regions remained intact. Homeostatic upregulation or tonotopic reorganization would then be limited to the interspersed deprived neurons only, but would still lead to elevated activity or enhanced synchronicity, respectively, resulting in the presence of a tinnitus percept.

References

    1. Baguley D. M. (2002). Mechanisms of tinnitus. Br. Med. Bull. 63 195–212. - PubMed
    1. Baguley D. M. (2003). Hyperacusis. J. R. Soc. Med. 96 582–585. - PMC - PubMed
    1. Barker D., Plack C. J., Hall D. A. (2011). Reexamining the evidence for a pitch-sensitive region: a human fMRI study using iterated ripple noise. Cereb. Cortex. 10.1093/cercor/bhr065[Epubaheadofprint]. - DOI - PubMed
    1. Barnea G., Attias J., Gold S., Shahar A. (1990). Tinnitus with normal hearing sensitivity: extended high-frequency audiometry and auditory-nerve brain-stem-evoked responses. Audiology 29 36–45. - PubMed
    1. Baumgart F., Kaulisch T., Tempelmann C., Gaschler-Markefski B., Tegeler C., Schindler F., Stiller D., Scheich H. (1998). Electrodynamic headphones and woofers for application in magnetic resonance imaging scanners. Med. Phys. 25 2068–2070. - PubMed

LinkOut - more resources