

In silico Models of Alcohol Dependence and Treatment
- PMID: 22347195
- PMCID: PMC3271346
- DOI: 10.3389/fpsyt.2012.00004
In silico Models of Alcohol Dependence and Treatment
Abstract
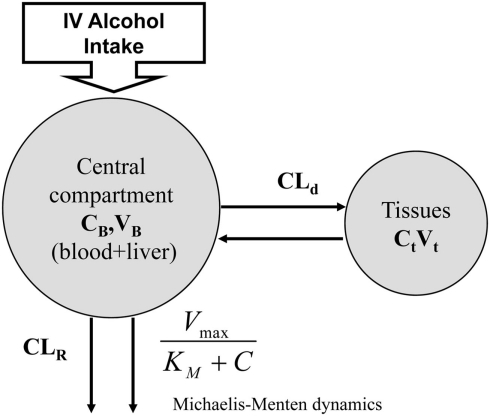
In this paper we view alcohol dependence and the response to treatment as a recurrent bio-behavioral process developing in time and propose formal models of this process combining behavior and biology in silico. The behavioral components of alcohol dependence and treatment are formally described by a stochastic process of human behavior, which serves as an event generator challenging the metabolic system. The biological component is driven by the biochemistry of alcohol intoxication described by deterministic models of ethanol pharmacodynamics and pharmacokinetics to enable simulation of drinking addiction in humans. Derived from the known physiology of ethanol and the literature of both ethanol intoxication and ethanol absorption, the different models are distilled into a minimal model (as simple as the complexity of the data allows) that can represent any specific patient. We use these modeling and simulation techniques to explain responses to placebo and ondansetron treatment observed in clinical studies. Specifically, the response to placebo was explained by a reduction of the probability of environmental reinforcement, while the effect of ondansetron was explained by a gradual decline in the degree of ethanol-induced neuromodulation. Further, we use in silico experiments to study critical transitions in blood alcohol levels after specific average number of drinks per day, and propose the existence of two critical thresholds in the human - one at 5 and another at 11 drinks/day - at which the system shifts from stable to critical and to super critical state indicating a state of alcohol addiction. The advantages of such a model-based investigation are that (1) the process of instigation of alcohol dependence and its treatment can be deconstructed into meaningful steps, which allow for individualized treatment tailoring, and (2) physiology and behavior can be quantified in different (animal or human) studies and then the results can be integrated in silico.
Keywords: alcohol dependence; computer simulation; metabolic modeling; stochastic process.
Figures


References
-
- Albisser A. M., Leibel B. S., Ewart T. G., Davidovac Z., Botz C. K., Zingg W. (1974). An artificial endocrine pancreas. Diabetes 23, 389–396 - PubMed
-
- American Psychiatric Association (1987). Diagnostic and Statistical Manual of Mental Disorders, 3rd Edn Washington, DC: American Psychiatric Press
-
- Bergman R. N., Ider Y. Z., Bowden C. R., Cobelli C. (1979). Quantitative estimation of insulin sensitivity. Am. J. Physiol. 236, E667–E677 - PubMed
-
- Breton M. D. (2010). In silico models of alcohol kinetics: deterministic approach,” in Addiction Medicine: Science and Practice, ed. Johnson B. (New York: Springer; ), 1265–1276
LinkOut - more resources
Full Text Sources