. 2012 Feb 6:3:13.
doi: 10.3389/fpsyg.2012.00013. eCollection 2012.

Rethinking the role of top-down attention in vision: effects attributable to a lossy representation in peripheral vision

Affiliations

Rethinking the role of top-down attention in vision: effects attributable to a lossy representation in peripheral vision

Ruth Rosenholtz et al. Front Psychol. .

Abstract

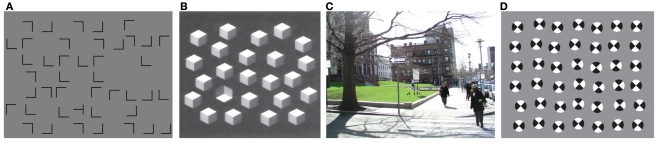
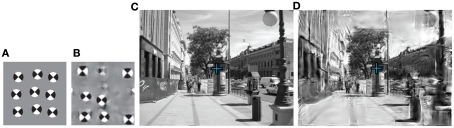
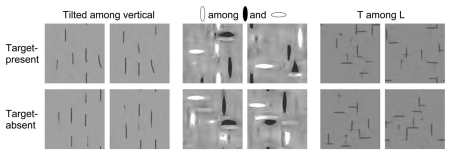
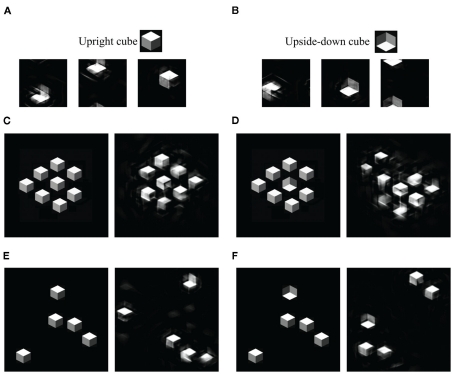
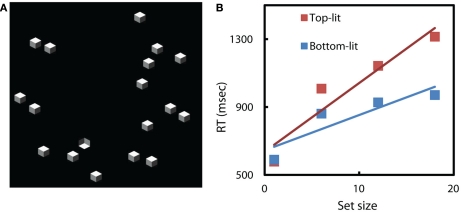
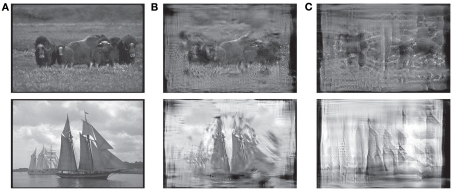
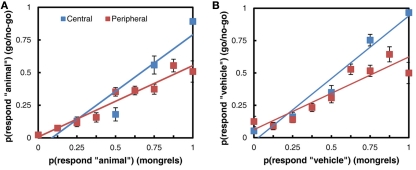
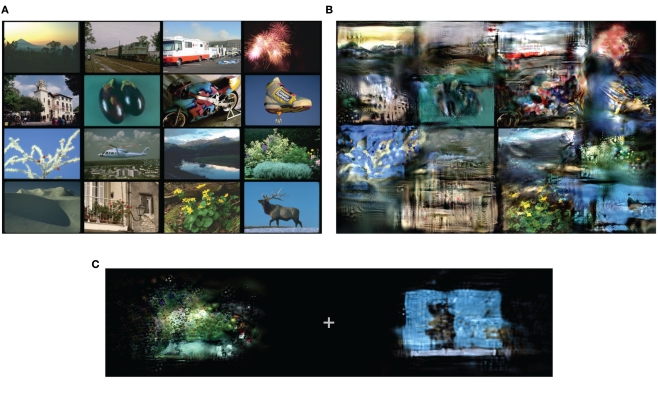
According to common wisdom in the field of visual perception, top-down selective attention is required in order to bind features into objects. In this view, even simple tasks, such as distinguishing a rotated T from a rotated L, require selective attention since they require feature binding. Selective attention, in turn, is commonly conceived as involving volition, intention, and at least implicitly, awareness. There is something non-intuitive about the notion that we might need so expensive (and possibly human) a resource as conscious awareness in order to perform so basic a function as perception. In fact, we can carry out complex sensorimotor tasks, seemingly in the near absence of awareness or volitional shifts of attention ("zombie behaviors"). More generally, the tight association between attention and awareness, and the presumed role of attention on perception, is problematic. We propose that under normal viewing conditions, the main processes of feature binding and perception proceed largely independently of top-down selective attention. Recent work suggests that there is a significant loss of information in early stages of visual processing, especially in the periphery. In particular, our texture tiling model (TTM) represents images in terms of a fixed set of "texture" statistics computed over local pooling regions that tile the visual input. We argue that this lossy representation produces the perceptual ambiguities that have previously been as ascribed to a lack of feature binding in the absence of selective attention. At the same time, the TTM representation is sufficiently rich to explain performance in such complex tasks as scene gist recognition, pop-out target search, and navigation. A number of phenomena that have previously been explained in terms of voluntary attention can be explained more parsimoniously with the TTM. In this model, peripheral vision introduces a specific kind of information loss, and the information available to an observer varies greatly depending upon shifts of the point of gaze (which usually occur without awareness). The available information, in turn, provides a key determinant of the visual system's capabilities and deficiencies. This scheme dissociates basic perceptual operations, such as feature binding, from both top-down attention and conscious awareness.

Keywords: compression; limited capacity; model; peripheral vision; scene perception; search; selective attention.


Figures

Figure 1
Figure 1
Challenges for a model of vision. (A) Search is sometimes difficult, even when target (T) and distractors (L) are quite discriminable. (B) Yet search is sometimes easy for fairly complex shapes, such as shaded cubes (adapted by permission from Macmillan Publishers Ltd: Nature 379: 165–168, copyright 1996). Furthermore, it is easy to get the gist of a scene (C) or of an array of items (D).
Figure 2
Figure 2
Visual crowding. The “A” on the left is easy to recognize, if it is large enough, whereas the A amidst the word “BOARD” can be quite difficult to identify. This cannot be explained by a mere loss of acuity in peripheral vision.
Figure 3
Figure 3
(A) Original image. (B) We can visualize the information available in a set of summary statistics by synthesizing a new “sample” with the same statistics as the original. Here we constrain the statistics for a single pooling region (the whole image). (C) Original photograph. (D) A new “sample,” which has the same local summary statistics as the original. The local regions overlap, tile the visual field, and grow linearly with distance from the fixation (blue cross).
Figure 4
Figure 4
(A) In visual search, we propose that on each fixation (red cross), the visual system computes a fixed set of summary statistics over each local patch. Some patches contain a target and distractors (blue), whereas most contain only distractors (green). The job of the visual system is to distinguish between promising and unpromising peripheral patches and to move the eyes accordingly. (B) We hypothesize, therefore, that peripheral patch discriminability, based on a rich set of summary statistics, critically limits search performance. To test this, we select a number of target + distractor and distractor-only patches, and generate a number of patches with the same statistics (“mongrels”). We then ask observers to discriminate between target + distractor and distractor-only synthesized patches, and examine whether this discriminability predicts search difficulty.
Figure 5
Figure 5
Example mongrels for target-present (row 1) and target-absent (row 2) patches, for three classic search conditions. (A) tilted among vertical; (B) orientation–contrast conjunction search; (C) T among L. How discriminable are target-present from target-absent mongrels? Inspection suggests that the summary statistic model correctly predicts easy search for tilted among vertical, more difficult conjunction search, and yet more difficult search for T among L, as validated by results in Figure 6.
Figure 6
Figure 6
Search performance vs. statistical discriminability. y-Axis: search performance for correct target-present trials, as measured by log 10 (search efficiency), i.e., the mean number of milliseconds (ms) of search time divided by the number of display items. x-Axis: “statistical discriminability” of target-present from target-absent patches based on the empirical discriminability, d′, of the corresponding mongrels. There is a strong relationship between search difficulty and mongrel discriminability, in agreement with our predictions. [y-axis error bars = SE of the mean; x-axis error bars = 95% confidence intervals for log 10 (d′)].
Figure 7
Figure 7
Mongrels of shaded cubes. (A) Mongrels synthesized from an image containing a single upright cube (inset). (B) Mongrels of an image with a single inverted cube (inset). The statistics have difficulty discriminating an upright from inverted cube. (C–F) Original (left) and mongrel (right) pairs. (C,D) Patches from a dense, regular display. (E,F) Patches from a sparse display. For the dense display, the target-absent mongrel shows no sign of a target, while the target-present mongrel does. For the sparse display, both mongrels show signs of a target. (Single pooling region mongrels wrap around both horizontally and vertically, so a cube may start at the top and end at the bottom of the image. The mongrels in (C–F) have been shifted to the middle, for easy viewing.)
Figure 8
Figure 8
(A)An example of our search displays. Target is an inverted cube; distractors are upright cubes. (B) More irregular search displays leads to less efficient search, for this task. Average response times on correct target-present trials vs search set size. RT slope of searching for upright is 40 ms/item, the slope of searching for inverted cube is 21 ms/item.
Figure 9
Figure 9
Example stimuli from animal- and vehicle-detection tasks. (A) Target images used in the go/no-go task. (B) Mongrels synthesized with fixation in the center of the image. (C) Mongrels synthesized with fixation 11° left of the image center.
Figure 10
Figure 10
Comparison of mongrel and go/no-go responses. (A) Animal vs. non-animal task. (B) Vehicle vs. non-vehicle task.
Figure 11
Figure 11
(A) A scene search array in the style of VanRullen et al. (2004). (B) A mongrel version of the array, fixation at center. It is difficult to determine, from the mongrel, whether there is an animal. (C) Mongrels generated from two scenes from the array (the elk and the hedge), shown in isolation in the periphery. In this case, it is easy to determine which image contains the animal.

References

    1. Allport A. (1993). Attention and control: have we been asking the wrong question? Atten. Perform. 14, 183–219
    1. Alvarez G. A. (2011). Representing multiple objects as an ensemble enhances visual cognition. Trends Cogn. Sci. (Regul. Ed.) 15, 122–131 10.1016/j.tics.2011.01.003 - DOI - PubMed
    1. Attneave F. (1954). Some informational aspects of visual perception. Psychol. Rev. 61, 183–193 10.1037/h0054663 - DOI - PubMed
    1. Baars B. J. (2005). Global workspace theory of consciousness: toward a cognitive neuroscience of human experience. Prog. Brain Res. 150, 45–53 10.1016/S0079-6123(05)50004-9 - DOI - PubMed
    1. Balas B. (2006). Texture synthesis and perception: using computational models to study texture representations in the human visual system. Vision Res. 46, 299–309 10.1016/j.visres.2005.04.013 - DOI - PubMed

LinkOut - more resources