

Clotrimazole preferentially inhibits human breast cancer cell proliferation, viability and glycolysis
- PMID: 22347377
- PMCID: PMC3275602
- DOI: 10.1371/journal.pone.0030462
Clotrimazole preferentially inhibits human breast cancer cell proliferation, viability and glycolysis
Abstract
Background: Clotrimazole is an azole derivative with promising anti-cancer effects. This drug interferes with the activity of glycolytic enzymes altering their cellular distribution and inhibiting their activities. The aim of the present study was to analyze the effects of clotrimazole on the growth pattern of breast cancer cells correlating with their metabolic profiles.
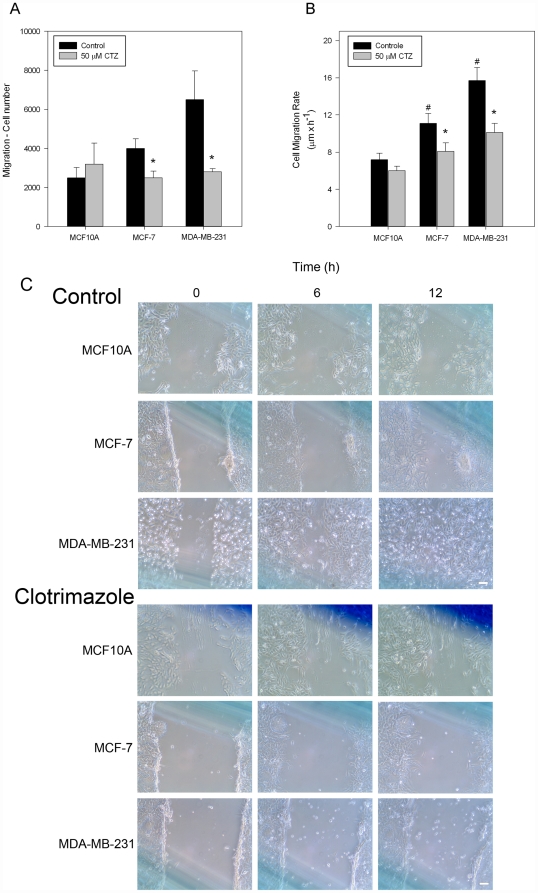
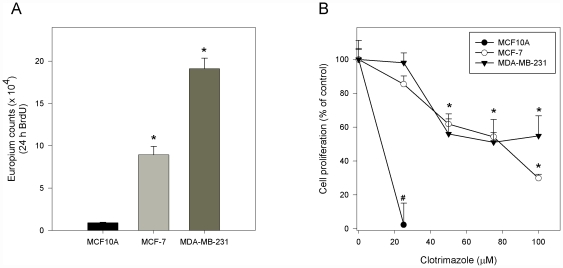
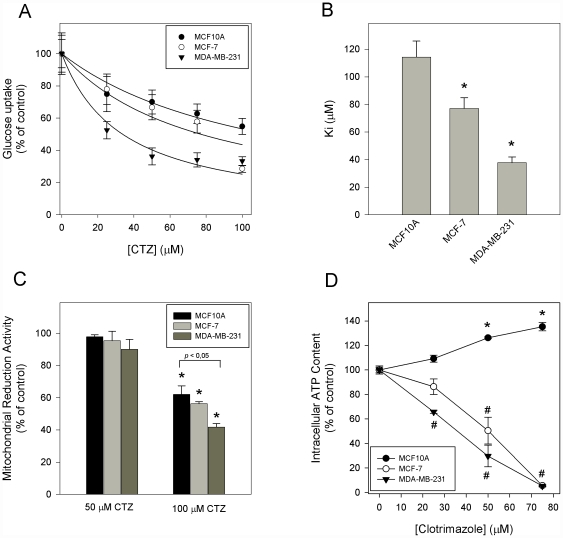
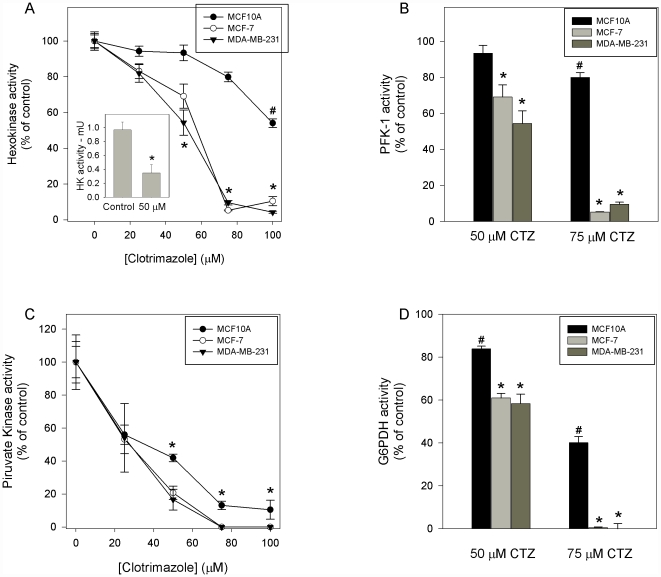
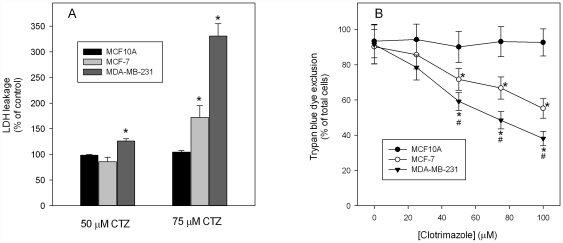
Methodology/principal findings: Three cell lines derived from human breast tissue (MCF10A, MCF-7 and MDA-MB-231) that present increasingly aggressive profiles were used. Clotrimazole induces a dose-dependent decrease in glucose uptake in all three cell lines, with K(i) values of 114.3±11.7, 77.1±7.8 and 37.8±4.2 µM for MCF10A, MCF-7 and MDA-MB-231, respectively. Furthermore, the drug also decreases intracellular ATP content and inhibits the major glycolytic enzymes, hexokinase, phosphofructokinase-1 and pyruvate kinase, especially in the highly metastatic cell line, MDA-MB-231. In this last cell lineage, clotrimazole attenuates the robust migratory response, an effect that is progressively attenuated in MCF-7 and MCF10A, respectively. Moreover, clotrimazole reduces the viability of breast cancer cells, which is more pronounced on MDA-MB-231.
Conclusions/significance: Clotrimazole presents deleterious effects on two human breast cancer cell lines metabolism, growth and migration, where the most aggressive cell line is more affected by the drug. Moreover, clotrimazole presents little or no effect on a non-tumor human breast cell line. These results suggest, at least for these three cell lines studied, that the more aggressive the cell is the more effective clotrimazole is.
Conflict of interest statement
Figures
Similar articles
-
Combination of imatinib and clotrimazole enhances cell growth inhibition in T47D breast cancer cells.Chem Biol Interact. 2015 May 25;233:147-56. doi: 10.1016/j.cbi.2015.03.028. Epub 2015 Apr 8. Chem Biol Interact. 2015. PMID: 25863232
-
Clotrimazole decreases human breast cancer cells viability through alterations in cytoskeleton-associated glycolytic enzymes.Mol Genet Metab. 2005 Apr;84(4):354-62. doi: 10.1016/j.ymgme.2004.11.012. Mol Genet Metab. 2005. PMID: 15781197
-
Ifosfamide metabolite chloroacetaldehyde inhibits cell proliferation and glucose metabolism without decreasing cellular ATP content in human breast cancer cells MCF-7.J Appl Toxicol. 2010 Apr;30(3):204-11. doi: 10.1002/jat.1485. J Appl Toxicol. 2010. PMID: 19774546
-
Nanomicellar Formulation of Clotrimazole Improves Its Antitumor Action toward Human Breast Cancer Cells.PLoS One. 2015 Jun 22;10(6):e0130555. doi: 10.1371/journal.pone.0130555. eCollection 2015. PLoS One. 2015. PMID: 26098874 Free PMC article.
-
The determinants of metabolic discrepancies in aerobic glycolysis: Providing potential targets for breast cancer treatment.Biochimie. 2024 May;220:107-121. doi: 10.1016/j.biochi.2024.01.003. Epub 2024 Jan 4. Biochimie. 2024. PMID: 38184121 Review.
Cited by
-
Targeting Cancer Hallmarks Using Selected Food Bioactive Compounds: Potentials for Preventive and Therapeutic Strategies.Foods. 2024 Aug 26;13(17):2687. doi: 10.3390/foods13172687. Foods. 2024. PMID: 39272454 Free PMC article. Review.
-
Clotrimazole inhibits growth of multiple myeloma cells in vitro via G0/G1 arrest and mitochondrial apoptosis.Sci Rep. 2024 Jul 4;14(1):15406. doi: 10.1038/s41598-024-66367-5. Sci Rep. 2024. PMID: 38965397 Free PMC article.
-
Imidazole Antifungal Drugs Inhibit the Cell Proliferation and Invasion of Human Breast Cancer Cells.Biomol Ther (Seoul). 2018 Sep 1;26(5):494-502. doi: 10.4062/biomolther.2018.042. Biomol Ther (Seoul). 2018. PMID: 30092625 Free PMC article.
-
Pantoprazole inhibits human gastric adenocarcinoma SGC-7901 cells by downregulating the expression of pyruvate kinase M2.Oncol Lett. 2016 Jan;11(1):717-722. doi: 10.3892/ol.2015.3912. Epub 2015 Nov 13. Oncol Lett. 2016. PMID: 26870273 Free PMC article.
-
Clotrimazole as a Cancer Drug: A Short Review.Med Chem (Los Angeles). 2014;4(11):722-724. doi: 10.4172/2161-0444.1000219. Med Chem (Los Angeles). 2014. PMID: 26819835 Free PMC article.
References
-
- Marin-Hernandez A, Rodriguez-Enriquez S, Vital-Gonzalez PA, Flores-Rodriguez FL, Macias-Silva M, et al. Determining and understanding the control of glycolysis in fast-growth tumor cells. Flux control by an over-expressed but strongly product-inhibited hexokinase. FEBS J. 2006;273:1975–1988. - PubMed
-
- Meadows AL, Kong B, Berdichevsky M, Roy S, Rosiva R, et al. Metabolic and morphological differences between rapidly proliferating cancerous and normal breast epithelial cells. Biotechnol Prog. 2008;24:334–341. - PubMed
-
- Hsu PP, Sabatini DM. Cancer Cell Metabolism: Warburg and Beyond. Cell. 2008;134:703–707. - PubMed
-
- Gillies RJ, Robey I, Gatenby RA. Causes and consequences of increased glucose metabolism of cancers. J Nucl Med. 2008;49(Suppl 2):24S–42S. - PubMed
Publication types
MeSH terms
Substances
LinkOut - more resources
Full Text Sources
Medical
Miscellaneous
