. 2012;7(2):e30852.
doi: 10.1371/journal.pone.0030852. Epub 2012 Feb 8.

Extended co-expression of inhibitory receptors by human CD8 T-cells depending on differentiation, antigen-specificity and anatomical localization

Affiliations

Extended co-expression of inhibitory receptors by human CD8 T-cells depending on differentiation, antigen-specificity and anatomical localization

Lukas Baitsch et al. PLoS One. 2012.

Abstract

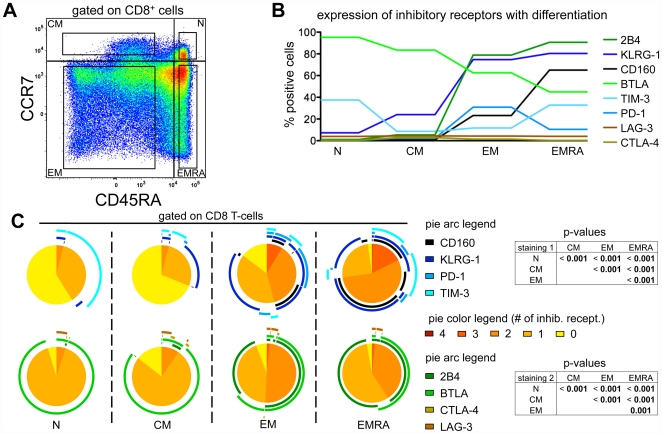
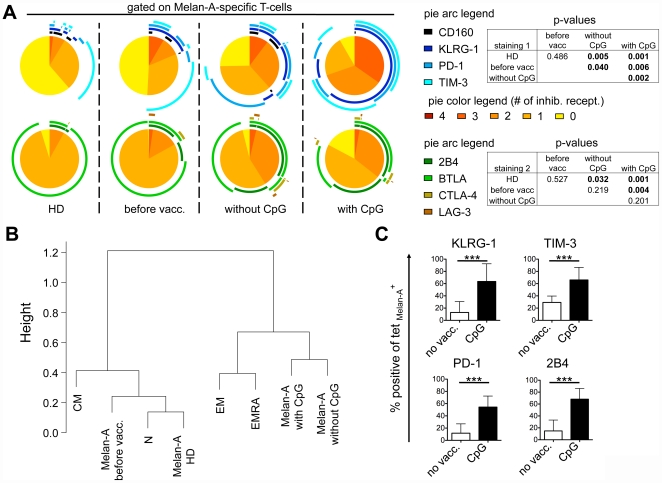
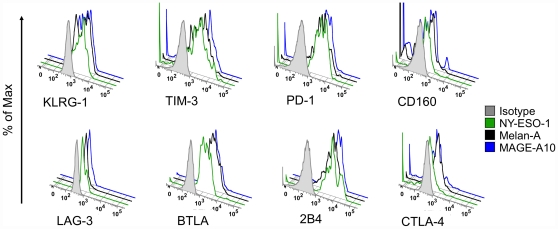
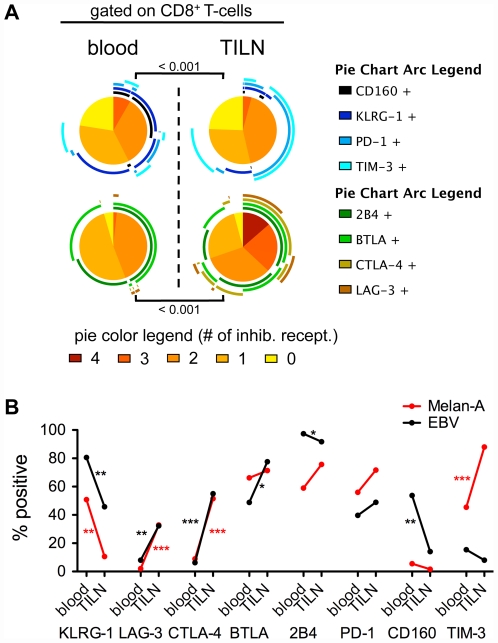
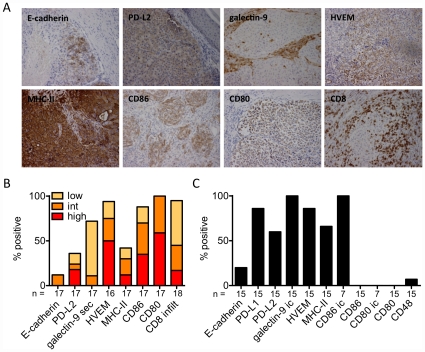
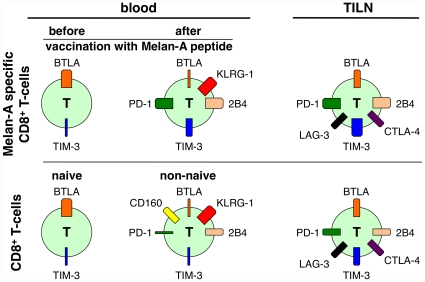
Inhibitory receptors mediate CD8 T-cell hyporesponsiveness against cancer and infectious diseases. PD-1 and CTLA-4 have been extensively studied, and blocking antibodies have already shown clinical benefit for cancer patients. Only little is known on extended co-expression of inhibitory receptors and their ligands. Here we analyzed the expression of eight inhibitory receptors by tumor-antigen specific CD8 T-cells. We found that the majority of effector T-cells simultaneously expressed four or more of the inhibitory receptors BTLA, TIM-3, LAG-3, KRLG-1, 2B4, CD160, PD-1 and CTLA-4. There were major differences depending on antigen-specificity, differentiation and anatomical localization of T-cells. On the other hand, naive T-cells were only single or double positive for BTLA and TIM-3. Extended co-expression is likely relevant for effector T-cells, as we found expression of multiple ligands in metastatic lesions of melanoma patients. Together, our data suggest that naive T-cells are primarily regulated by BTLA and TIM-3, whereas effector cells interact via larger numbers of inhibitory receptors. Blocking multiple inhibitory receptors simultaneously or sequentially may improve T-cell based therapies, but further studies are necessary to clarify the role of each receptor-ligand pair.


Conflict of interest statement

Competing Interests: The authors have declared that no competing interests exist.

Figures

Figure 1
Figure 1. Expression profiles of inhibitory receptors with differentiation.
(A) CD8 T-cell subsets were defined depending on expression of CCR7 and CD45RA, namely naive (N), central memory (CM), effector memory (EM) and effector memory RA+ (EMRA) cells. Gates used for inhibitory receptor analysis are shown in the four quadrants. (B) Mean values of inhibitory receptor expression in relation to the differentiation status. Individual values are shown in Figure S1B. n = 31 for “staining 1” (KLRG-1, TIM-3, PD-1 and CD160); n = 21 for “staining 2” (LAG-3, BTLA, 2B4 and CTLA-4); four samples of staining 1 were from healthy donors, the remaining from melanoma patients. (C) Co-expression of KLRG-1, TIM-3, PD-1 and CD160 (staining 1) and of LAG-3, BTLA, 2B4 and CTLA-4 (staining 2). Colors of the pie arcs depict the expression of individual inhibitory receptors, while the color in the pie depicts the number of co-expressed inhibitory receptors. p-values of the permutation test are shown in tables next to the corresponding pie charts. Co-expression was analyzed with SPICE 5.2.
Figure 2
Figure 2. Inhibitory receptor expression by Melan-A specific CD8 T-cells depending on vaccination.
(A) Co-expression of KLRG-1, TIM-3, PD-1 and CD160, and of LAG-3, BTLA, 2B4 and CTLA-4 by Melan-A specific CD8 T-cells. Blood samples from healthy donors (HD) or from patients before immunotherapy (before vacc.) or after peptide+IFA vaccination with or without CpG-ODN 7909 were enriched for CD8 T-cells using magnetic beads. Melan-A-specific CD8 T-cells were identified by staining with CD8-specific antibody and tetramer. Positivity for inhibitory receptors was defined respective to isotype controls. n = 4 for HD; n = 3 for before vacc.; n = 9 for after vaccination without CpG-ODN and n = 11 for after vaccination with CpG-ODN. Colors of the pie arcs depict the expression of individual inhibitory receptors, while the color in the pie depicts the number of co-expressed inhibitory receptors. Co-expression was analyzed with SPICE 5.2. p-values of the permutation test are shown in tables next to the corresponding pie charts. (B) Hierarchical clustering based on co-expression data of the eight inhibitory receptors shown in A, including the four differentiation subsets (N, CM, EM, EMRA) of total CD8 T-cells. (C) Mean expression and SD of four inhibitory receptors upregulated on Melan-A-specific T-cells with vaccination. Data from HD and from patients before vaccination were pooled for the group without vaccination (no vacc.). n = 7 for no vacc.; n = 9 for vaccination with CpG-ODN.
Figure 3
Figure 3. Expression of inhibitory receptors on self/tumor-specific T-cells.
Expression of inhibitory receptors by Melan-A, NY-ESO-1 and MAGE-A10-specific T-cells from a representative patient (LAU 1169). CD8 T-cells were enriched using magnetic bead sorting. Melan-A- (black), NY-ESO-1- (green) and MAGE-A10- (blue) specific CD8 T-cells were identified by tetramer staining as described in the Materials and Methods section. An isotype control (grey) is shown as reference.
Figure 4
Figure 4. Expression of inhibitory receptors by CD8 T-cells derived from blood and tumor-infiltrated lymph nodes (TILNs).
(A) Co-expression analysis of total CD8 T-cells. Colors of the pie arcs depict the expression of individual inhibitory receptors, while the color in the pie depicts the number of co-expressed inhibitory receptors. Co-expression was analyzed with SPICE 5.2. n = 9/8 (TILN) and 31/17 (blood) for staining 1 and staining 2 respectively. (B) Melan-A- (red) and EBV- (black) specific CD8 T-cells. Positivity for the inhibitory receptor was defined respective to isotype controls. Blood samples were from patients vaccinated either with CpG-ODN or without CpG-ODN. n = 20/21 (blood; Melan-A/EBV) and n = 9/6 (TILN; Melan-A/EBV) for staining 1; n = 23/24 (blood; Melan-A/EBV) and n = 8/5 (TILN; Melan-A/EBV) for staining 2 except BTLA, and n = 8/7 (TILN; Melan-A/EBV) for BTLA.
Figure 5
Figure 5. Expression of ligands of inhibitory receptors in melanoma metastases and by melanoma cell lines.
(A,B) Paraffin-embedded tumor sections from 16 to 18 tumors were stained by immunohistochemistry for seven inhibitory receptors and CD8. (A) Representative stainings (magnification ×200) for each ligand investigated. (B) Summary of immunohistochemical stainings represented as percent of positive samples. Low (<10%), intermediate (int; 10–50%) and high (>50%) expression is indicated in a color scale. infilt: infiltration of CD8 T-cells in tumor cell nests; sec: secreted i.e. intra- and extracellular presence of galectin-9. (C) Summary of expression by melanoma cell lines on the surface or intracellular (ic) as percent of positive cell lines.
Figure 6
Figure 6. Schematic representation of inhibitory receptor co-expression according to differentiation status and physical location.
Naive cells express BTLA and TIM-3. After peptide vaccination, Melan-A specific T-cells upregulate KLRG-1, 2B4, TIM-3 and PD-1, while they downregulate BTLA. Total CD8 T-cells upregulate similar inhibitory receptors, but less PD-1 and TIM-3. They also express CD160, which is not expressed by tumor-specific T-cells. In TILN, both total CD8 T-cells, which are to a large extent tumor-specific, and Melan-A specific T-cells downregulate KLRG-1 (and in total CD8 T-cells CD160) and concomitantly express more PD-1, LAG-3, TIM-3 and CTLA-4.

References

    1. Baitsch L, Baumgaertner P, Devevre E, Raghav SK, Legat A, et al. Exhaustion of tumor-specific CD8+ T cells in metastases from melanoma patients. J Clin Invest. 2011;121:2350–2360. - PMC - PubMed
    1. Holmes S, He M, Xu T, Lee PP. Memory T cells have gene expression patterns intermediate between naive and effector. Proc Natl Acad Sci U S A. 2005;102:5519–5523. - PMC - PubMed
    1. Willinger T, Freeman T, Hasegawa H, McMichael AJ, Callan MF. Molecular signatures distinguish human central memory from effector memory CD8 T cell subsets. J Immunol. 2005;175:5895–5903. - PubMed
    1. Wherry EJ, Ha SJ, Kaech SM, Haining WN, Sarkar S, et al. Molecular signature of CD8+ T cell exhaustion during chronic viral infection. Immunity. 2007;27:670–684. - PubMed
    1. Bengsch B, Seigel B, Ruhl M, Timm J, Kuntz M, et al. Coexpression of PD-1, 2B4, CD160 and KLRG1 on exhausted HCV-specific CD8+ T cells is linked to antigen recognition and T cell differentiation. PLoS Pathog. 2010;6:e1000947. - PMC - PubMed

Publication types

MeSH terms