. 2012;7(2):e31609.
doi: 10.1371/journal.pone.0031609. Epub 2012 Feb 7.

Three dimensional visualization and fractal analysis of mosaic patches in rat chimeras: cell assortment in liver, adrenal cortex and cornea

Affiliations

Three dimensional visualization and fractal analysis of mosaic patches in rat chimeras: cell assortment in liver, adrenal cortex and cornea

Stephen Iannaccone et al. PLoS One. 2012.

Abstract

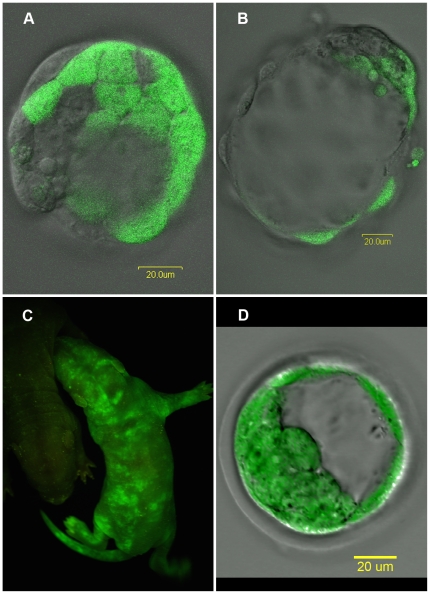
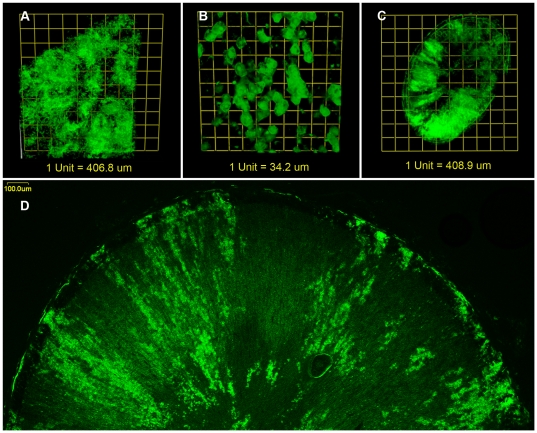
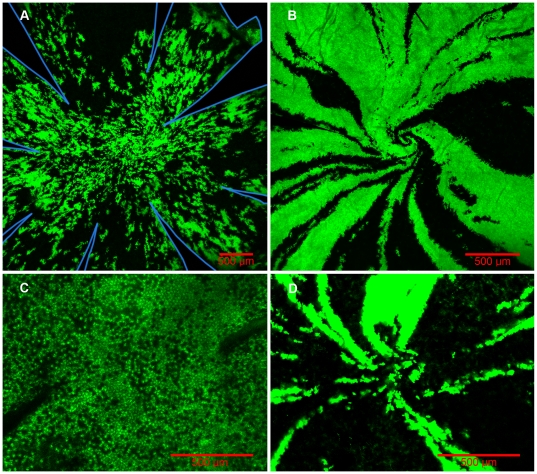
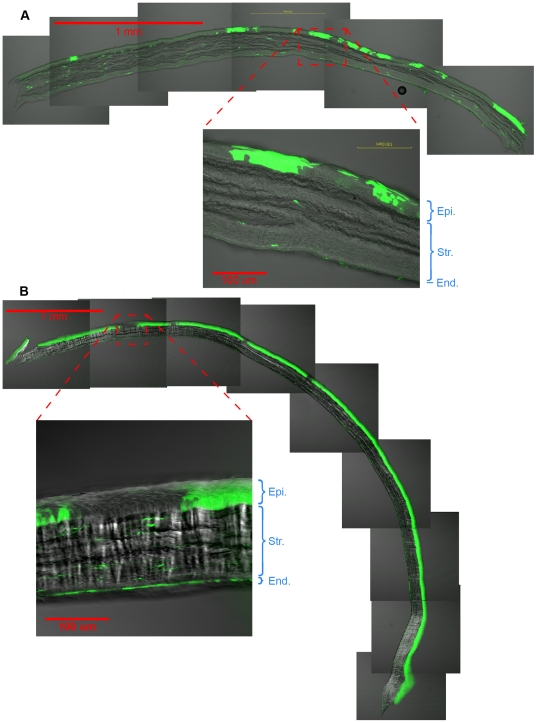
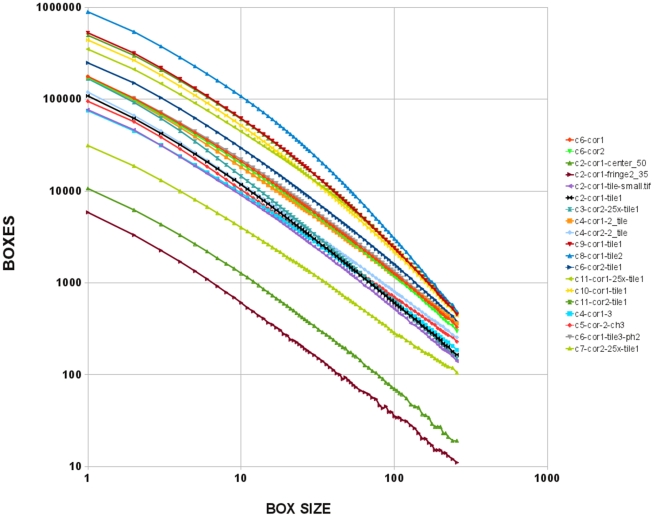
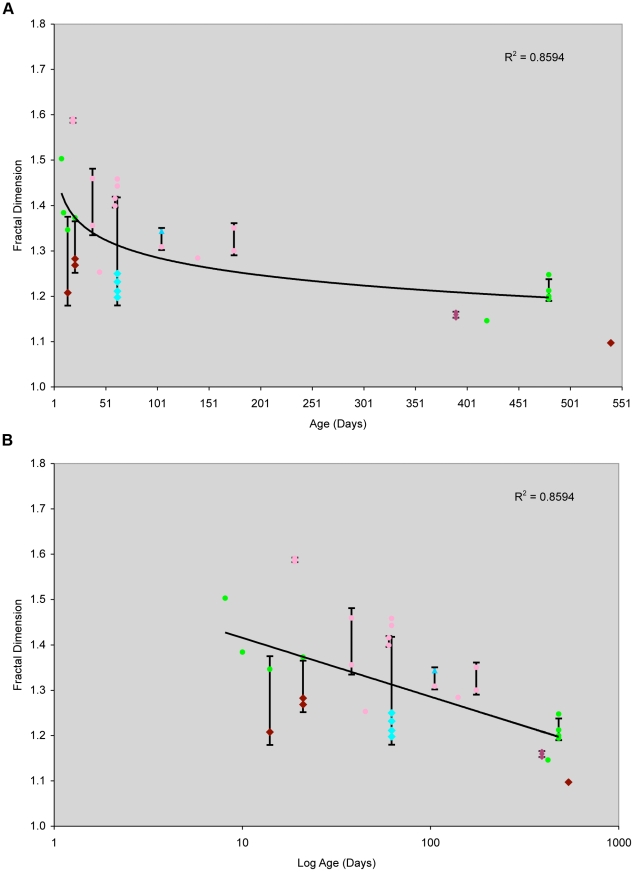
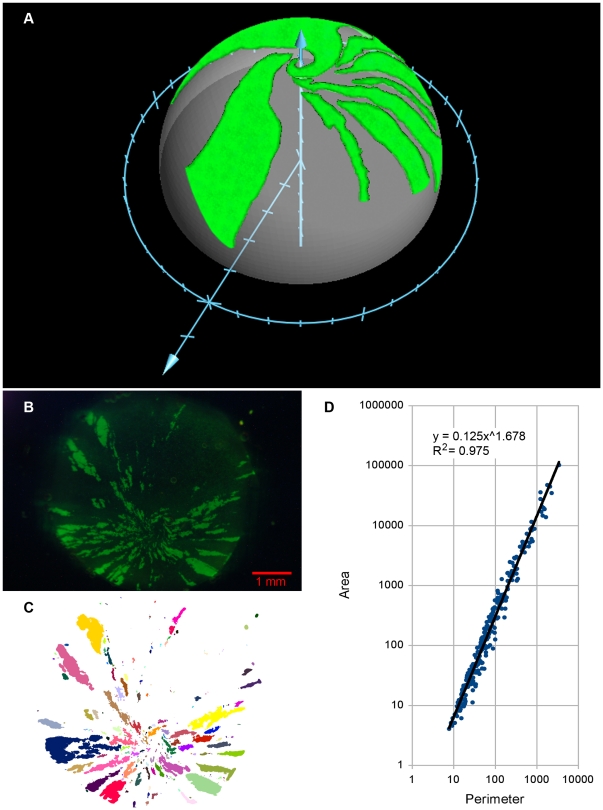
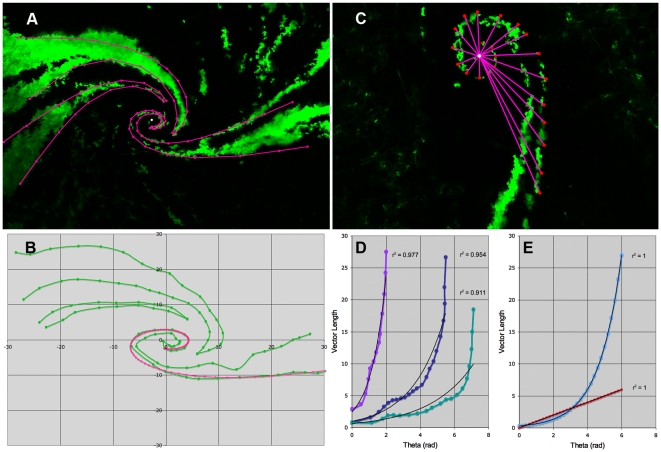
The production of organ parenchyma in a rapid and reproducible manner is critical to normal development. In chimeras produced by the combination of genetically distinguishable tissues, mosaic patterns of cells derived from the combined genotypes can be visualized. These patterns comprise patches of contiguously similar genotypes and are different in different organs but similar in a given organ from individual to individual. Thus, the processes that produce the patterns are regulated and conserved. We have previously established that mosaic patches in multiple tissues are fractal, consistent with an iterative, recursive growth model with simple stereotypical division rules. Fractal dimensions of various tissues are consistent with algorithmic models in which changing a single variable (e.g. daughter cell placement after division) switches the mosaic pattern from islands to stripes of cells. Here we show that the spiral pattern previously observed in mouse cornea can also be visualized in rat chimeras. While it is generally held that the pattern is induced by stem cell division dynamics, there is an unexplained discrepancy in the speed of cellular migration and the emergence of the pattern. We demonstrate in chimeric rat corneas both island and striped patterns exist depending on the age of the animal. The patches that comprise the pattern are fractal, and the fractal dimension changes with the age of the animal and indicates the constraint in patch complexity as the spiral pattern emerges. The spiral patterns are consistent with a loxodrome. Such data are likely to be relevant to growth and cell division in organ systems and will help in understanding how organ parenchyma are generated and maintained from multipotent stem cell populations located in specific topographical locations within the organ. Ultimately, understanding algorithmic growth is likely to be essential in achieving organ regeneration in vivo or in vitro from stem cell populations.


Conflict of interest statement

Competing Interests: The authors have declared that no competing interests exist.

Figures

Figure 1
Figure 1. Production of rat chimeras.
Rat chimeras were produced by morulae aggregation where one morula is from a transgenic eGFP lineage and the other is of wild type lineage. (A) These distinct cell lineages can be seen in the embryos before implantation. (B) Further culturing of these embryos reveals the labeled cells integrating into the inner cell mass. (C) A newborn chimera pup, right half of photograph, can be easily distinguished from a non-chimeric littermate, barely seen in the left half of the photograph, when visualized under blue light. (D) A transgenic eGFP blastocyst. Some areas of the transmitted image, where the light isn't restricted by the confocal aperture around the zona pelucida and the periphery of the blastocyst are out of focus which doesn't occur in the fluorescent image where all cells in the inner cell mass as well as the trophectoderm are clearly labeled with eGFP. Scale bars in (A), (B) and (D) are 20 µm.
Figure 2
Figure 2. Projection of rat chimera corneal image onto a hemisphere.
The cornea image, seen as the line across the top of the figure, was centered at the apex of a hemisphere, seen as the arc beneath the line, at point C. The location of the projected point P' on the hemisphere was calculated from the distance of the original point P on the image such that arclength CP' is equal to the original length CP.
Figure 3
Figure 3. Three-dimensional reconstruction of chimeric rat liver and adrenal gland.
(A) Liver from a chimeric rat was sectioned at 35 µm and imaged with confocal microscopy. One plane of focus was used to represent each 35 µm section. These sections were then stacked and aligned to render a three dimensional model illustrating the complex interconnected nature of the patches. The total area shown is approximately 4 mm by 4 mm with the eGFP lineage shown as green. (B) A higher magnification view of liver from a chimeric rat, the three-dimensional rendering was produced in a similar fashion as in (A) except that it was imaged under higher power to illustrate the detail of fluorescent patches with a total area shown approximately 0.35 mm by 0.35 mm. (C) This process of rendering a three dimensional model was repeated with cross sections of the adrenal gland. This highlights the radial cord-like structure of the fluorescent patches in the adrenal cortex, which are reminiscent of pencils in a cup. The total area shown is approximately 4 mm by 4 mm. (D) Cross section through the chimeric adrenal gland illustrates two types of patches: the clonally derived radial cord-like patterning of the interior of the cortex, and the stem-like appearance of the outer surface. The scale bar is 100 µm. Shown in (A), (B), and (C) are the first frames of animations of the rendered models being rotated. The full movies can be seen in Figure S1, Figure S2, and Figure S3 respectively.
Figure 4
Figure 4. Chimeric rat corneas.
(A) In young rat chimeras corneas display a geographic pattern reminiscent of islands in the sea, which is indicative of unconstrained growth of a stem cell like nature shown here from a 3 week-old animal. Areas where the cornea has been cut to relax it are outlined in blue. (B) This pattern transitions into a highly constrained pinwheel pattern in the adult rat illustrated here in a 16 month-old animal. (C) This pinwheel pattern is not present in the endothelial layer of the cornea. (D) Endothelial pattern is unrelated to that of the epithelium of the same cornea. The epithelium shown in (D) also displays several alternate patterns including arcs and branches in the pattern. eGFP lineage is green. Scale bars = 500 µm.
Figure 5
Figure 5. Cross sections of chimeric rat corneas.
(A) Cross sections of chimeric rat corneas reveal that there is no concordance between patches of cells labeled in the epithelium and those labeled in the endothelium. (B) Also apparent is the lack of extensive lateral mixing of cells in the epithelial layer. Cells form mostly contiguous patches through the thickness of the epithelium. Epi. is the epithelium, Str. is the stroma, and End. is the endothelium. eGFP lineage is green.
Figure 6
Figure 6. Fractal dimension of chimeric rat corneas.
Once images of the chimeric rat corneas are turned into binary images, the fractal dimension is determined from the slope of the regression line of box counting data. The box counting data is collected over several orders of magnitude in size and regression lines are fitted to log-log plots of the number of boxes counted versus the size of the box. Shown here are the log-log plots of 19 images from 10 chimeric rats, demonstrating that they are fractal.
Figure 7
Figure 7. Development of chimeric rat cornea patterning.
The transition to stripes and spirals occurs rapidly around 2 months of age. The timeline at the top of the figure displays animal ages where the cornea pattern was examined (vertical red lines) over the range of 8 days-old to 18 months-old. Below is an expanded view of the first 6 months following birth with selected representative images of corneal epitehlium to highlight the rapid transformation of pattern.
Figure 8
Figure 8. Chimeric rat cornea fractal dimension as a function of animal age.
Fractal dimensions were measured for 18 out of 20 chimeric rats spanning ages from 8 days-old to 18 months-old. As the animal ages the cornea pattern shifts from unconstrained geographic to highly constrained spirals. The fractal dimension decreases as the animal ages. The plots displaying this decrease in complexity are shown in a linear scale (A) and semi-log scale for age (B). For cases where more than one image was analyzed for the same age, error bars are shown for ±1 standard deviation from the mean. Because the resolution at which the image was collected can have some influence on the measured fractal dimension, data points are colored based on the original image's resolution.
Figure 9
Figure 9. Projection of cornea patch data onto a hemisphere, and unrelaxed chimera cornea patches are fractal.
(A) To ensure that no gross deformities in patch geometry occurred as a result of relaxing the corneas prior to imaging them, patch edges from the flattened images were projected back onto a hemisphere. This transformation was done as described in Methods. Edge points were plotted on a hemisphere to show the results in three dimensions. No abnormalities or anomalies were observed. (B) Prior to being relaxed, a 3.5 month-old chimeric rat cornea was photographed (eGFP lineage is green) and the stereomicrograph was converted to a binary image (C) where each patch analyzed was assigned a color. (D) The fractal nature of the corneal patches was determined by examining the relationship of the area and the perimeter of each patch in a log-log plot. This relates the length of the perimeter of each patch measured at the highest resolution with area. When all the objects have ‘coastlines’ sharing the same fractal dimension, the points approach a line in a log-log plot. Furthermore, the slope of the regression line plot of log(area) on log(perimeter) is related to the fractal dimension as D = 2/slope.
Figure 10
Figure 10. Rat chimera cornea patch edges fit loxodromal spirals and a comparison with logarithmic spirals.
(A) A confocal image of a chimeric rat cornea was overlaid with spiral curves, shown in bright purple. Lines connecting the points were drawn in to illustrate the full curve. The white point marks the center of the calculated spirals. The fit of the mathematically generated spiral was performed visually in Excel by adjusting parameters until an acceptable agreement between the spiral and patch edge points collected was seen. (B) The calculated spiral was plotted along with the patch edge points to assess the fit. Parameters of the spiral generated in the figure were as follows: a = 0.067, λ0 = −1.2, r = 50, xstretch = 0.008, ystretch = 0.006, xshift = 0.5, and yshift = −0.5. This illustration is representative of fits made for 18 patch edges. (C) The distance from the center of a logarithmic spiral to the curve increases exponentially as one proceeds along the curve. A spiral patch is shown. A line was drawn from the center of the spiral to the patch edge at various positions along the patch edge shown in bright purple, and the lengths of these lines (vector lengths) were determined. (D) The vector length was plotted against the angle (theta) defined to be the change in direction from the innermost point along the patch edge in radians. Theta is oriented such that it is increasing regardless of the handedness of the spiral. Data from three representative patches are shown. The data were fit to both an exponential and a linear model, the correlation coefficient (r2) for the logarithmic fit is shown. Linear r2 values were lower than those of an exponential fit for every case. (E) Correlations were checked for ideal cases of logarithmic and Archimedean spirals generated from equations defining the curves. The logarithmic spiral fit exponentially and the Archimedean fit linearly; both had r2 values of 1.00 as expected. Fitting the logarithmic spiral linearly and the Archimedean exponentially yielded much lower values.

Similar articles

Cited by

References

    1. Iannaccone PM. The study of mammalian organogenesis by mosaic pattern analysis. Cell Differ. 1987;21:79–91. - PubMed
    1. Novak MM. Fractals and Beyond: Complexity in the Sciences; In: Novak MM, editor. Singapore, New Jersey, London, Hong Kong: World Scientific; 1998. 358
    1. Iannaccone P, Khokha M. Fractal Geometry in Biological Systems, An Analytical Approach. Boca Raton, New York, London, Tokyo: CRC Press; 1996. 360
    1. Khokha MK, Landini G, Iannaccone PM. Fractal geometry in rat chimeras demonstrates that a repetitive cell division program may generate liver parenchyma. Dev Biol. 1994;165:545–555. - PubMed
    1. Iannaccone PM. Fractal geometry in mosaic organs: a new interpretation of mosaic pattern. Faseb J. 1990;4:1508–1512. - PubMed

Publication types