

doi: 10.1007/s13244-010-0022-y.
Epub 2010 May 27.
MRI for assessment of anal fistula
- PMID: 22347906
- PMCID: PMC3259332
- DOI: 10.1007/s13244-010-0022-y
Item in Clipboard
MRI for assessment of anal fistula
Insights Imaging.
2010 May.
Abstract
Magnetic resonance imaging (MRI) is the best imaging modality for preoperative assessment of patients with anal fistula. MRI helps to accurately demonstrate disease extension and predict prognosis. This in turn helps make therapy decisions and monitor therapy. The pertinent anatomy, fistula classification and MRI findings will be discussed.
Figures
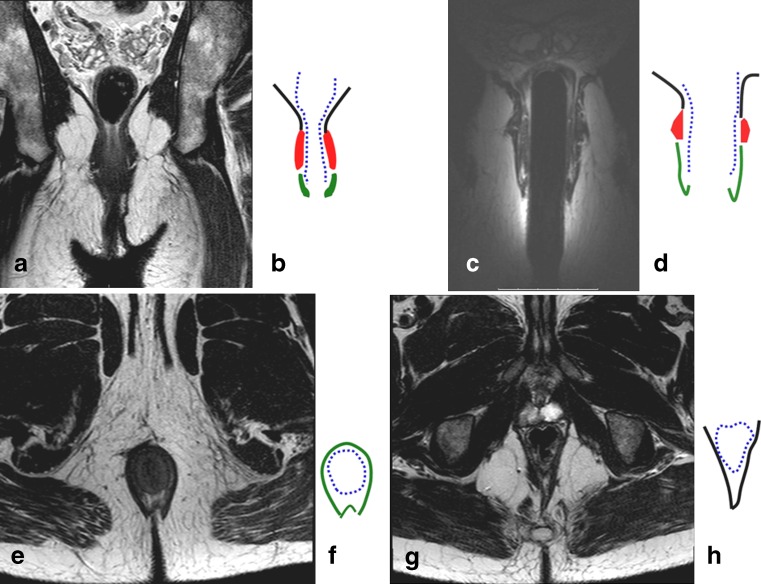
Coronal T2-weighted image of the pelvic floor obtained by surface coil (a), and schematic representation (b). Coronal T2-weighted image obtain by endoanal coil (c) and its schematic representation (d). Axial T2-weigted image at the level of sphincters (e) and the corresponding schematic image (f). Axial T2-weighted image at the level higher than the dentate line (g) and corresponding schematic image (h). On all schematic images the black lines represent levator ani muscle; the blue dotted line represents muscular propria and internal sphincter; the red areas represent external sphincter; and the green areas represent the external sphincter
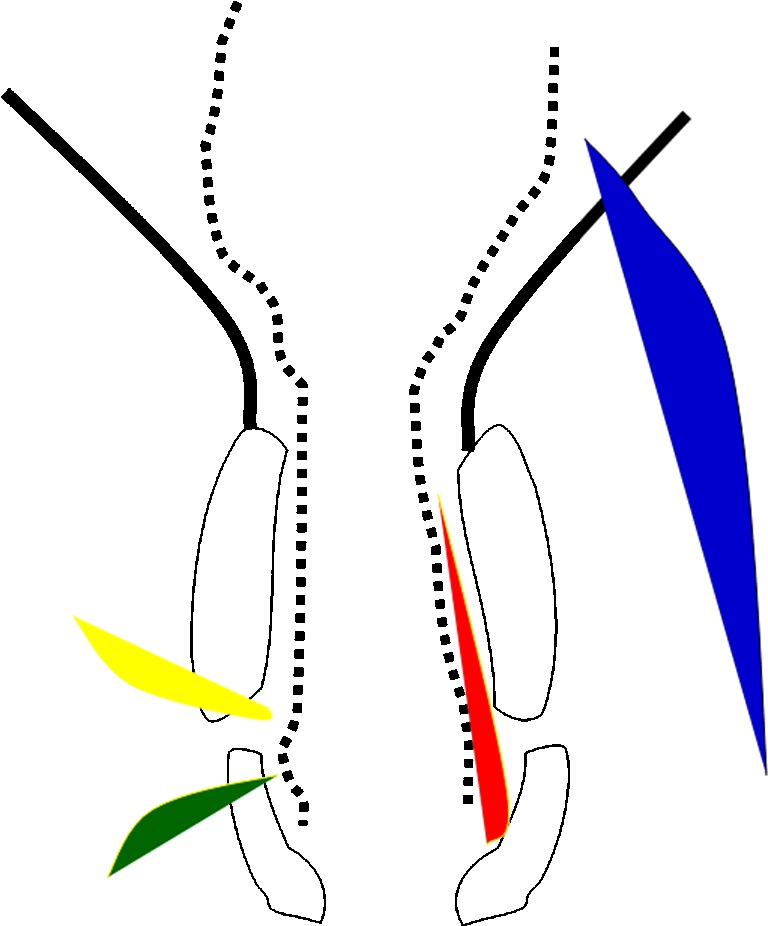
Schematic representation of the anal canal and pelvic musculature in black corresponding to Fig. 1b. The fistulas, as described by Parks, are represented by differently colored shaded areas: red for inter-sphincteric, green for trans-sphincteric, yellow for supra-sphincteric, and blue for extra-sphincteric
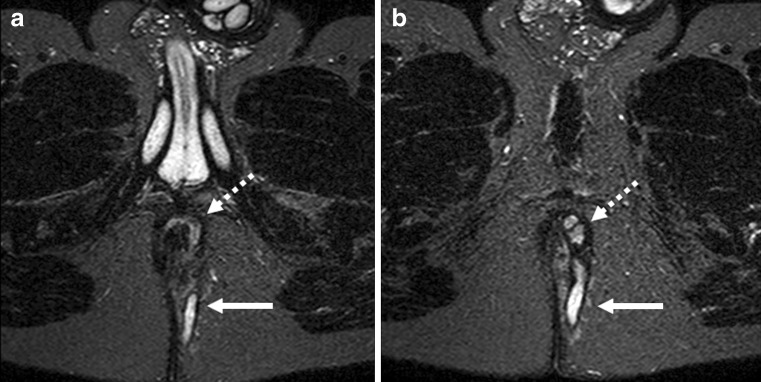
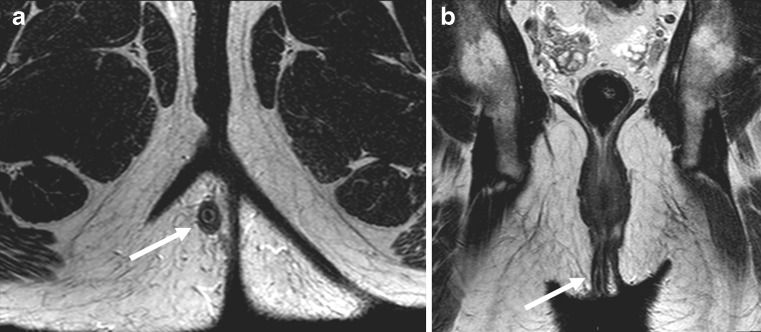
Axial T2-weighted images with fat suppression (STIR) at two different levels (a, b). The dotted arrows demonstrate the inter-sphincteric fistula and its extension to the skin (solid arrow)
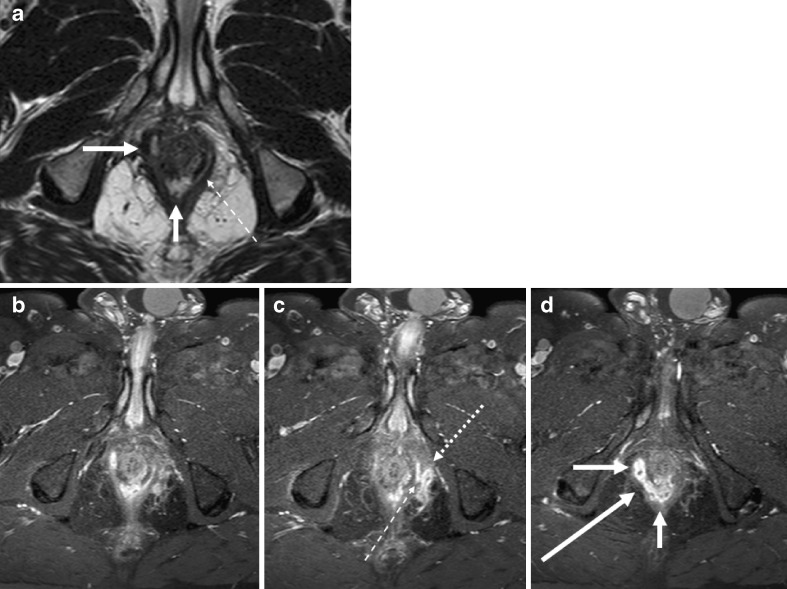
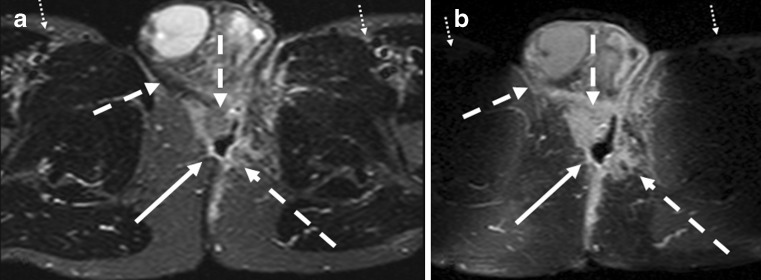
Complex fistula with both inter-sphincteric and trans-sphincteric components. An axial T2-weighted and three consecutive thin slice (1 mm) T1-weighted images with fat-saturation after gadolinium contrast. Images show inter-sphincteric fistula (white arrows). There is a thin communicating fistula stretching in the inter-sphincteric plane (thin hatched arrow), going through the external sphincter to reach the fistula lying outside the external sphincter (dotted arrow)
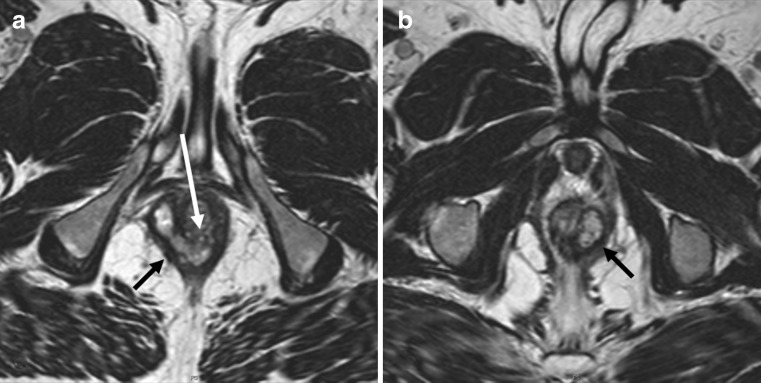
Two axial T2-weighted images (a, b) demonstrate thick fistula tracks (black arrows) lying between rectal muscular wall and the pelvic floor just above the puborectalis muscle. The internal opening is seen as a large opening into the dorsal aspect of anorectal junction (white arrow)
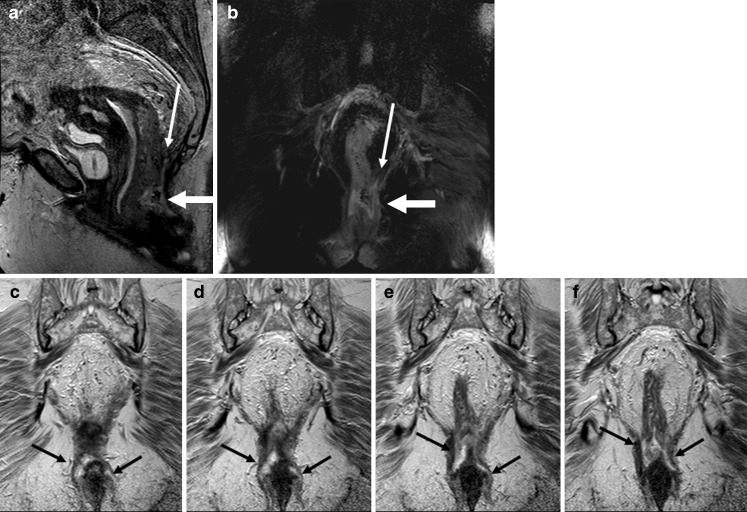
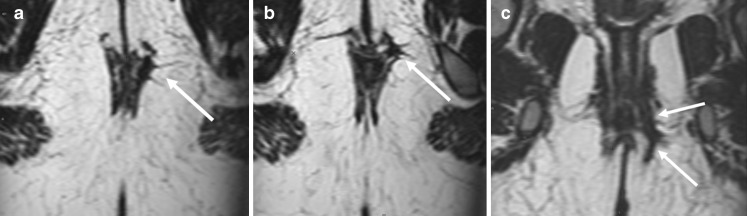
Sagittal T2-weighted image (a) and T2-weighted coronal image with fat-saturation (b) show an abscess (thick white arrows on a and b) at the level of anorectal junction. There is blind sinus (thin white arrow) extending upward above the pelvic floor. Consecutive coronal T2-weighted images (c–f) show extension of the abscess in the inter-sphincteric planes bilaterally down
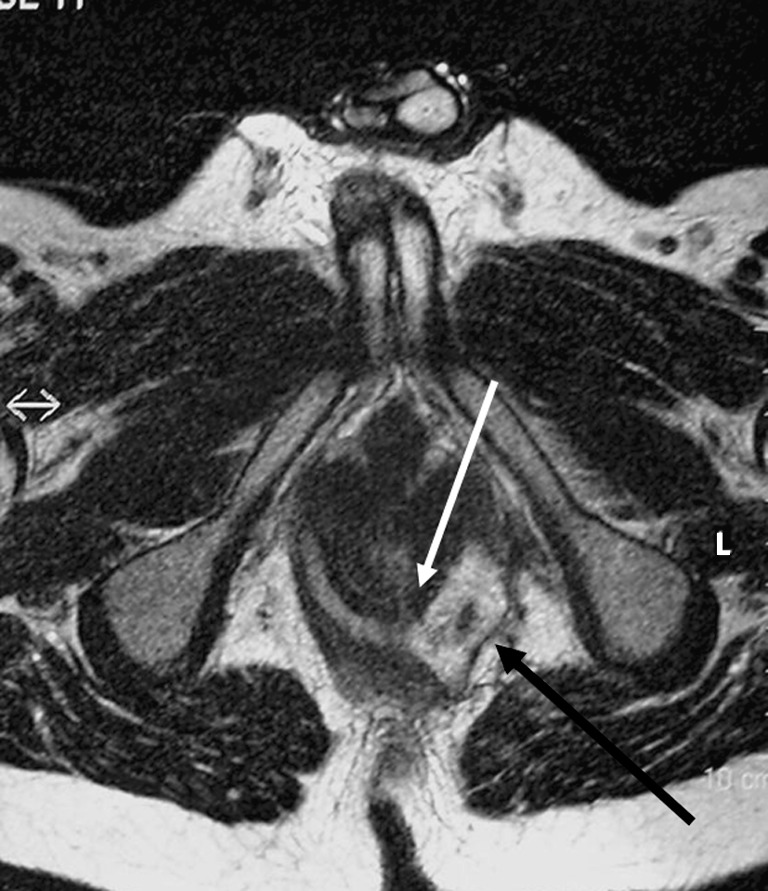
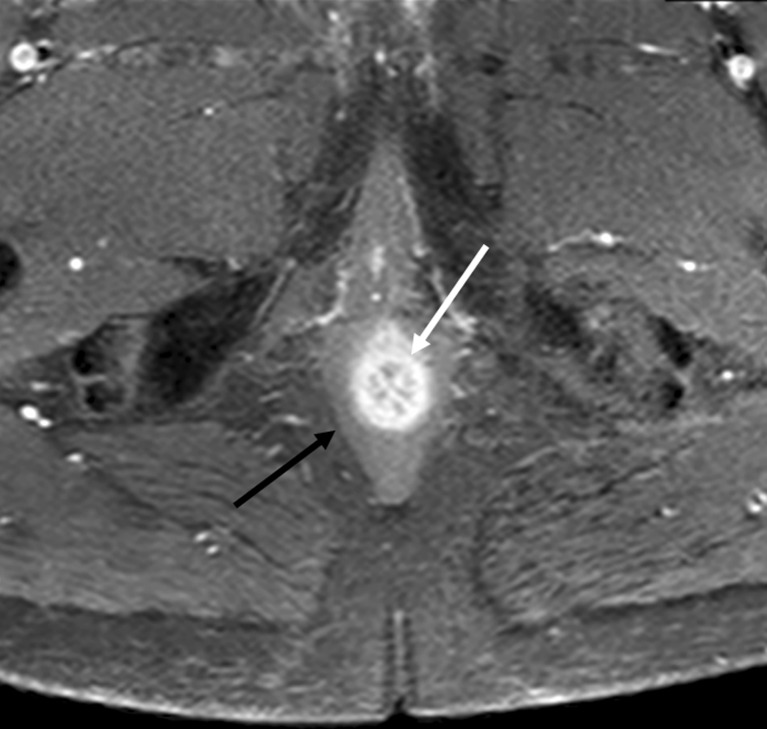
Horseshoe fistula in the intersphincteric plane on an axial T2-weighted image. The internal opening is located at 5–6 o’ clock as a thin white extension (white arrow). The left fistula is more an abscess with debris and extension beyond the external sphincter (black arrow)
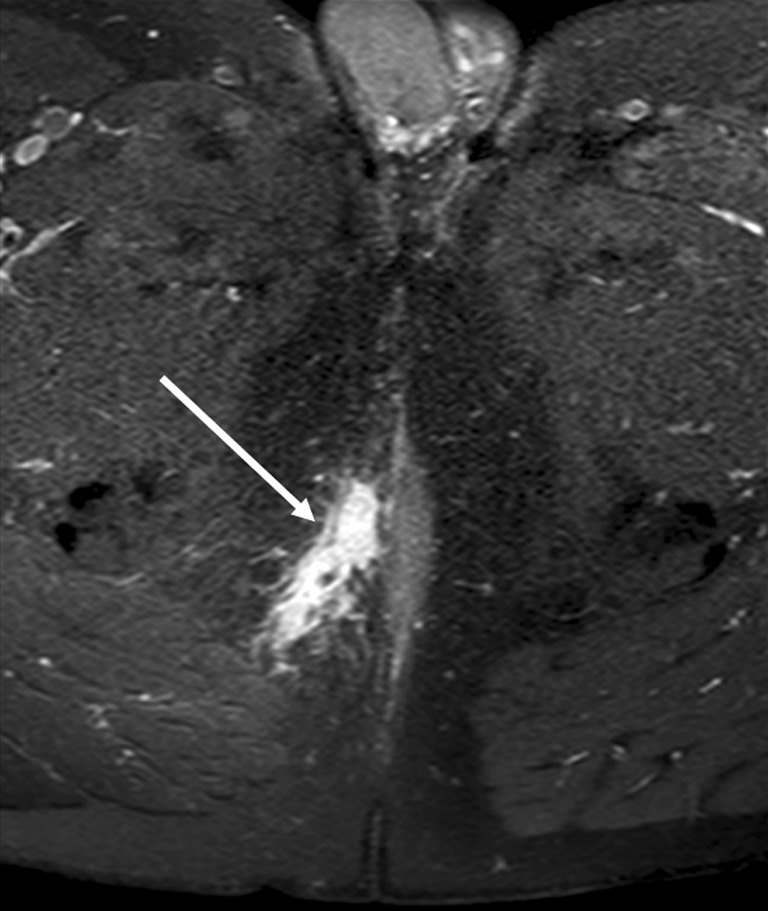
T1-weighted image with fat-saturation after gadolinium contrast enhancement. Inflammation around a fistula is depicted by avid contrast enhancement (white arrow). The entire abdomen and pelvis of patient had been imaged, and therefore a simpler protocol had been applied without TSE T2-weigted images over the pelvic area
Sagittal (a) and coronal (b) T2-weighted images of a patient treated with seton at follow-up. The seton is seen as a dark inner structure in the middle of the fistula (white arrows)
Reformatted axial (a, b) and coronal (c) T2-weighted images based on three-dimensional (3D) volume-based imaging. The fistula tract does not show any high signal intensity (white arrows) and this is indicative of fibrotic rest
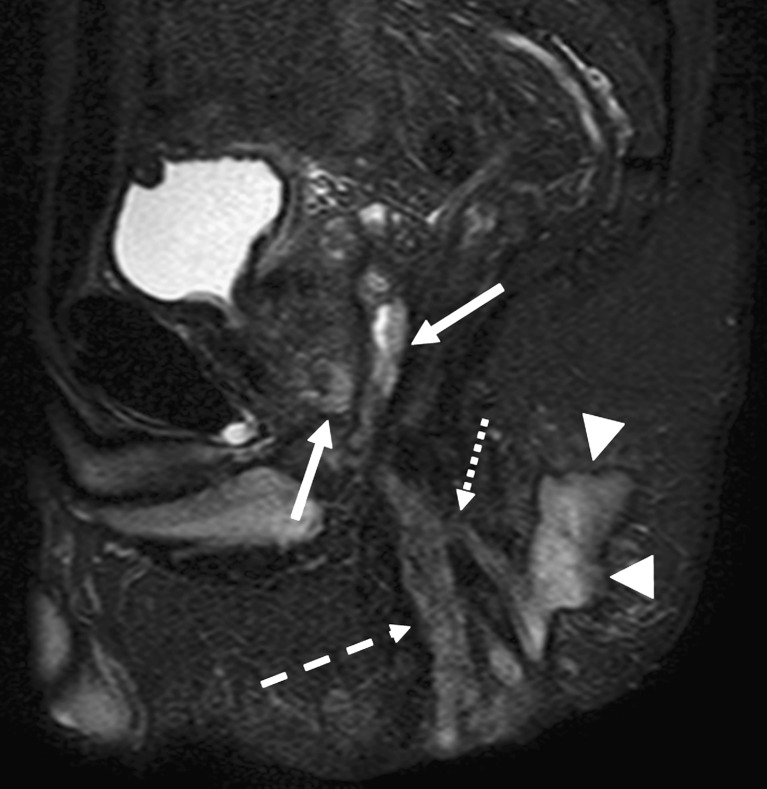
Sagittal T2-weighted image with fat-saturation. The ischioanal abscess (arrowheads) is communicating via a fistula (dotted arrow) to another fistula (hatched arrow). The peri-prostatic vessels and other structures with high-signal intensity on T2-weighted images (solid arrows) can cause confusion if mistaken for fistulas
The internal sphincter and anal mucosa (white arrow) normally show marked contrast enhancement (as shown on this axial T1-weighted image with fat-saturation) and higher signal on T2-weighted images. The external sphincter does not demonstrate the same amount of contrast enhancement
Patient with abscess behind the root of the scrotum. Axial STIR (a) and T1-weighted with contrast-enhancement (b) show an abscess (white arrows) with central cavity. The extension of the inflammation seems larger on contrast-enhanced images compared with STIR (hatched arrows). Also note the nonuniform fat saturation on b compared with a (small dotted arrows)
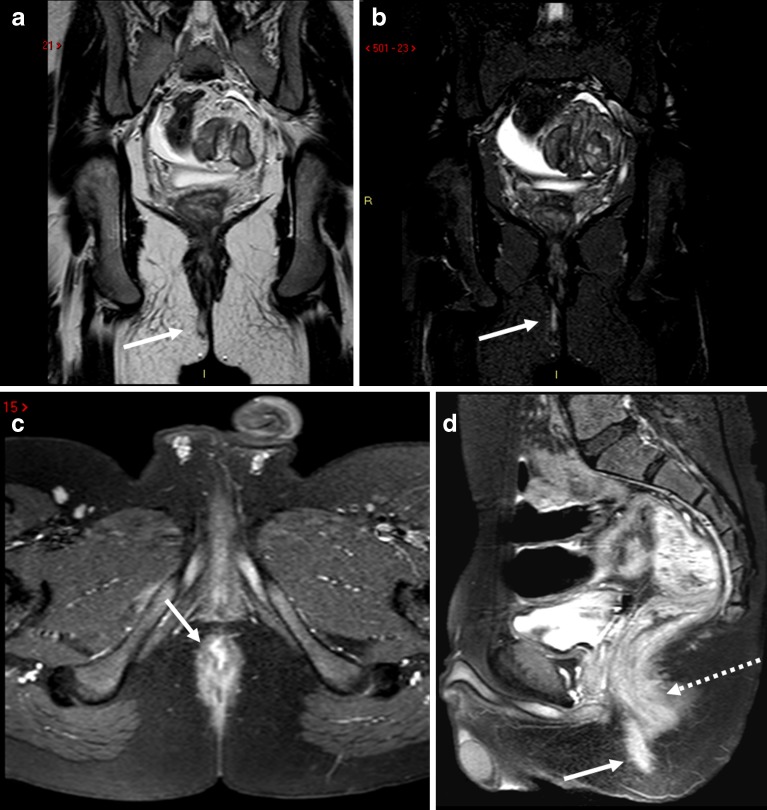
Simple fistula (white arrows) shown on TSE T2-weighted (a) and STIR (b) images. The axial T1-weighted image after gadolinium contrast (c) shows avid contrast enhancement of the fistula (white arrow) but to lesser degree the anal sphincter. The sagittal T1-weighted image (d) a few minutes later (note the filling of the urinary bladder) demonstrates decreased distinction in degree of contrast enhancement between the fistula (white arrow) and the anal sphincter (hatched arrow), consistent with time intensity curve characteristics described by Horsthuis et al. [13]
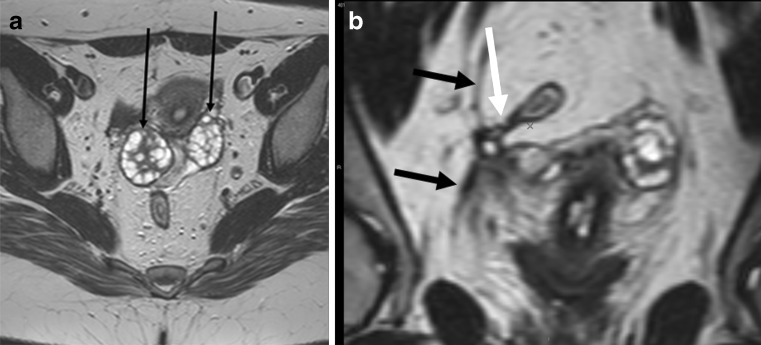
Patient with healed peri-anal fistula shown in Fig. 10. The larger field of view with surface coil enabled even demonstration of pathology in the pelvis. Axial T2-weighted image (a) and reformatted coronal image (b) demonstrate ovaries (small black arrows) drawn medially due to retraction of a healed abscess in the Douglas pouch. There is also fibrosis of right pelvic fascia (black arrows) retracted medially. Finally a small fistula is evident stretching from rectosigmoid junction (white arrow)
Similar articles
-
Evaluating postoperative anal fistula prognosis by diffusion-weighted MRI.Eur J Radiol. 2020 Nov;132:109294. doi: 10.1016/j.ejrad.2020.109294. Epub 2020 Sep 21. Eur J Radiol. 2020. PMID: 33038577
-
The contribution of preoperative MRI to the surgical management of anal fistulas.Diagn Interv Radiol. 2018 Nov;24(6):321-327. doi: 10.5152/dir.2018.18340. Diagn Interv Radiol. 2018. PMID: 30272562 Free PMC article.
-
Endoanal ultrasound or magnetic resonance imaging for preoperative assessment of anal fistula: a comparative study.Colorectal Dis. 2001 May;3(3):189-97. doi: 10.1046/j.1463-1318.2001.00241.x. Colorectal Dis. 2001. PMID: 12790988
-
Guidelines on postoperative magnetic resonance imaging in patients operated for cryptoglandular anal fistula: Experience from 2404 scans.World J Gastroenterol. 2021 Sep 7;27(33):5460-5473. doi: 10.3748/wjg.v27.i33.5460. World J Gastroenterol. 2021. PMID: 34588745 Free PMC article. Review.
-
Rectal imaging: part 2, Perianal fistula evaluation on pelvic MRI--what the radiologist needs to know.AJR Am J Roentgenol. 2012 Jul;199(1):W43-53. doi: 10.2214/AJR.11.8361. AJR Am J Roentgenol. 2012. PMID: 22733931 Review.
Cited by
-
Congenital Cheek Fistula: A Rare Case of Developmental Abnormality in the Buccal Area.Cureus. 2021 Jun 15;13(6):e15657. doi: 10.7759/cureus.15657. eCollection 2021 Jun. Cureus. 2021. PMID: 34277250 Free PMC article.
-
Evaluation of the Effectiveness of a Combination of Chinese Herbal Fumigation Sitz-Bath and Red Ointment in Managing Postoperative Wound Healing and Pain Control in Anal Fistula Patients.Contrast Media Mol Imaging. 2022 Sep 15;2022:1905279. doi: 10.1155/2022/1905279. eCollection 2022. Contrast Media Mol Imaging. 2022. Retraction in: Contrast Media Mol Imaging. 2023 Aug 2;2023:9767098. doi: 10.1155/2023/9767098. PMID: 36176927 Free PMC article. Retracted. Clinical Trial.
-
Factors Increasing the Risk of Recurrence in Fistula-in-ano.Cureus. 2019 Mar 7;11(3):e4200. doi: 10.7759/cureus.4200. Cureus. 2019. PMID: 31114719 Free PMC article. Review.
-
Development and validation of the MRI-based deep learning classifier for distinguishing perianal fistulizing Crohn's disease from cryptoglandular fistula: a multicenter cohort study.EClinicalMedicine. 2024 Nov 22;78:102940. doi: 10.1016/j.eclinm.2024.102940. eCollection 2024 Dec. EClinicalMedicine. 2024. PMID: 39640934 Free PMC article.
-
Prognostic factors affecting outcomes in fistulating perianal Crohn's disease: a systematic review.Tech Coloproctol. 2017 Jul;21(7):501-519. doi: 10.1007/s10151-017-1647-3. Epub 2017 Jun 20. Tech Coloproctol. 2017. PMID: 28639073 Free PMC article.
References
LinkOut - more resources
Full Text Sources