. 2011 Apr;2(2):177-191.
doi: 10.1007/s13244-010-0061-4. Epub 2011 Jan 8.

Imaging the spine in arthritis-a pictorial review

Affiliations

Imaging the spine in arthritis-a pictorial review

Anne Grethe Jurik. Insights Imaging. 2011 Apr.

Abstract

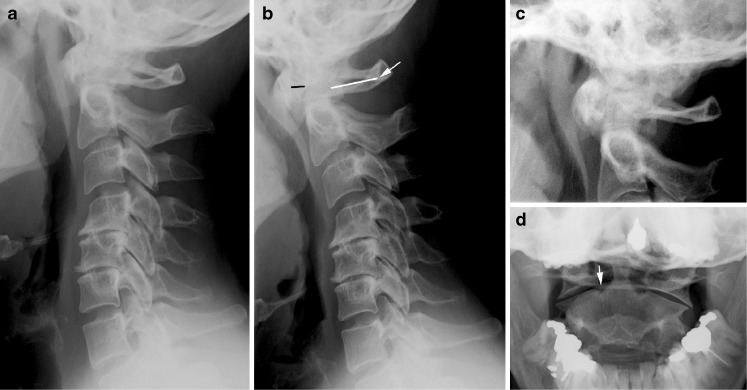
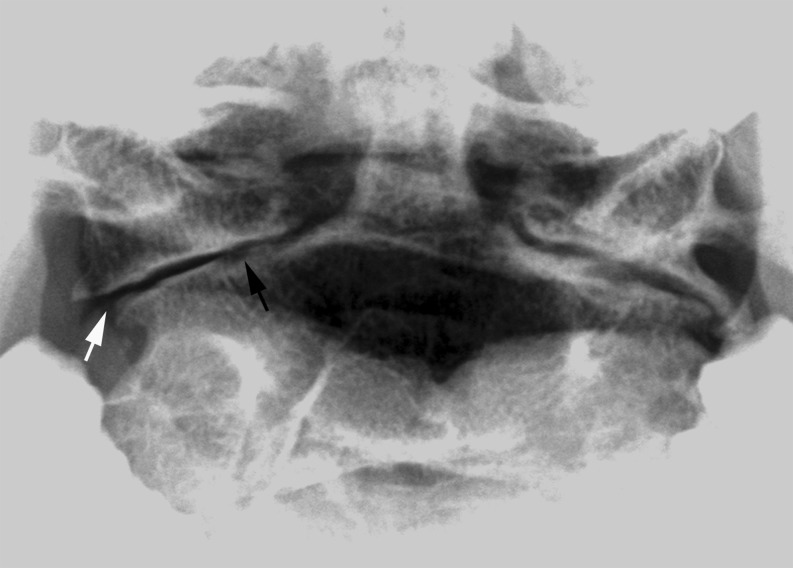
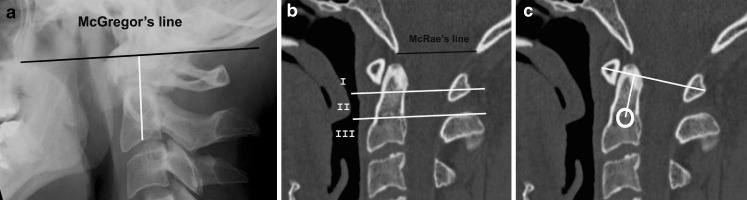
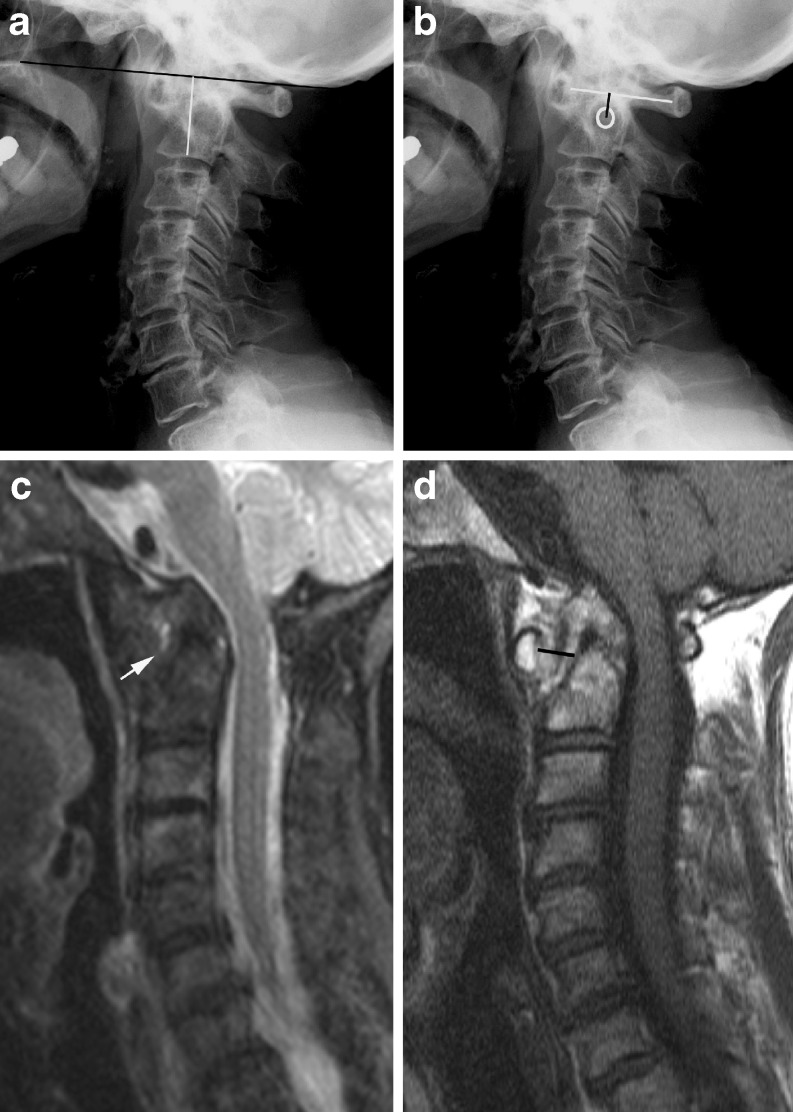
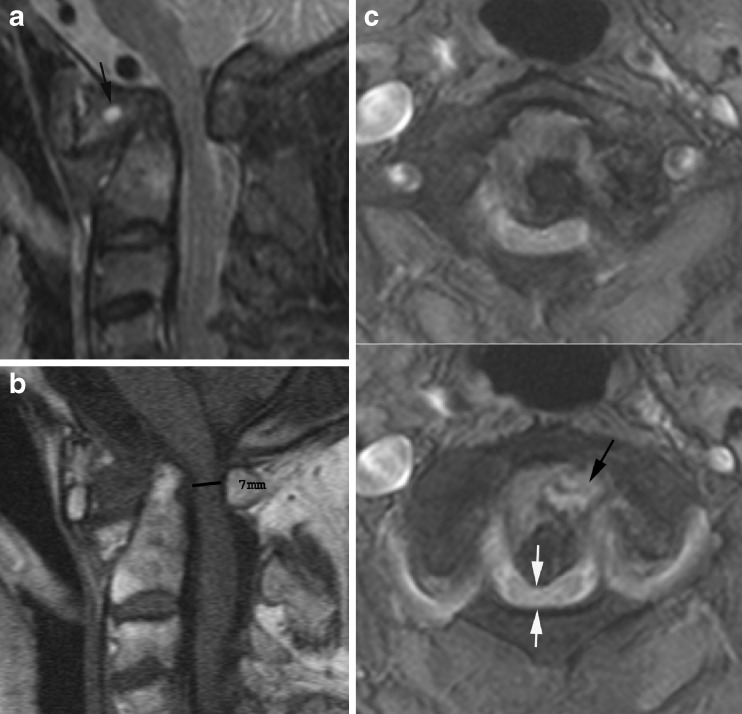
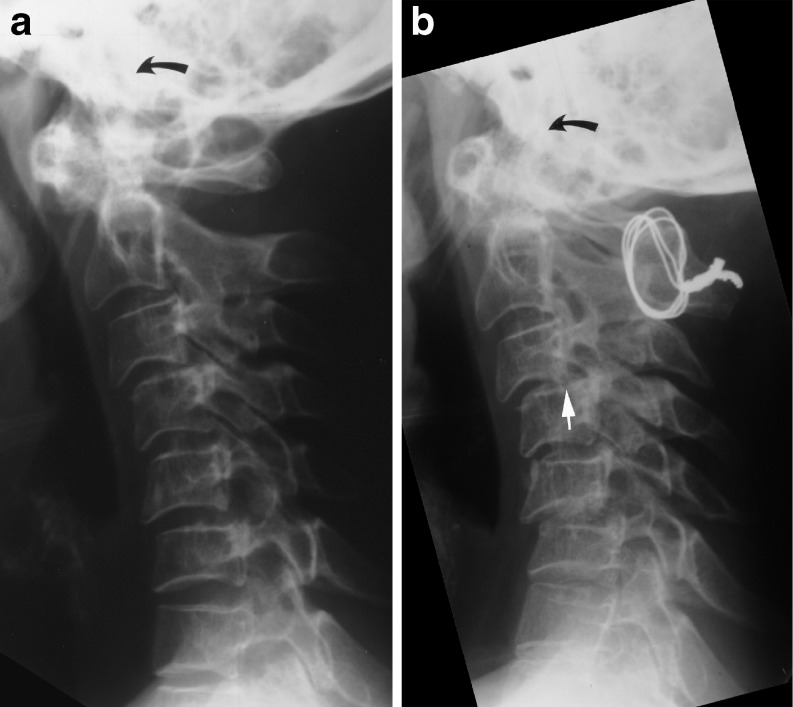
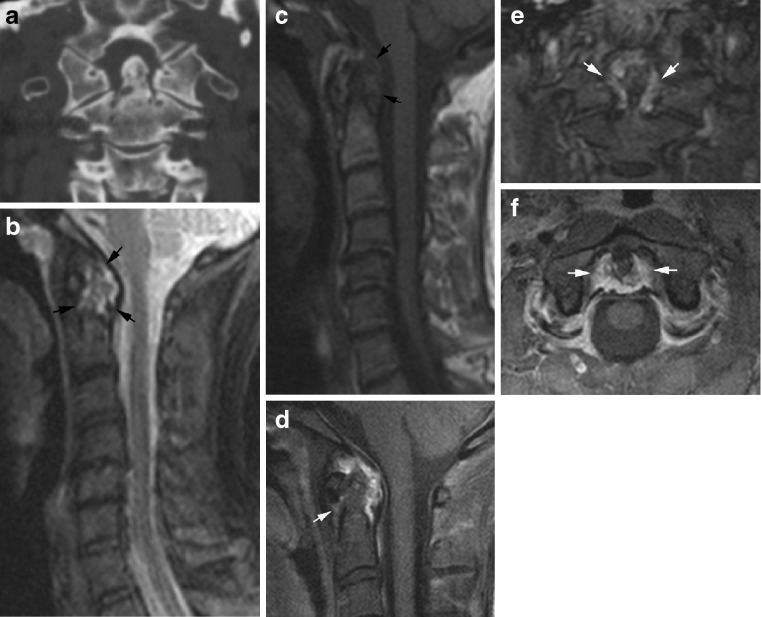
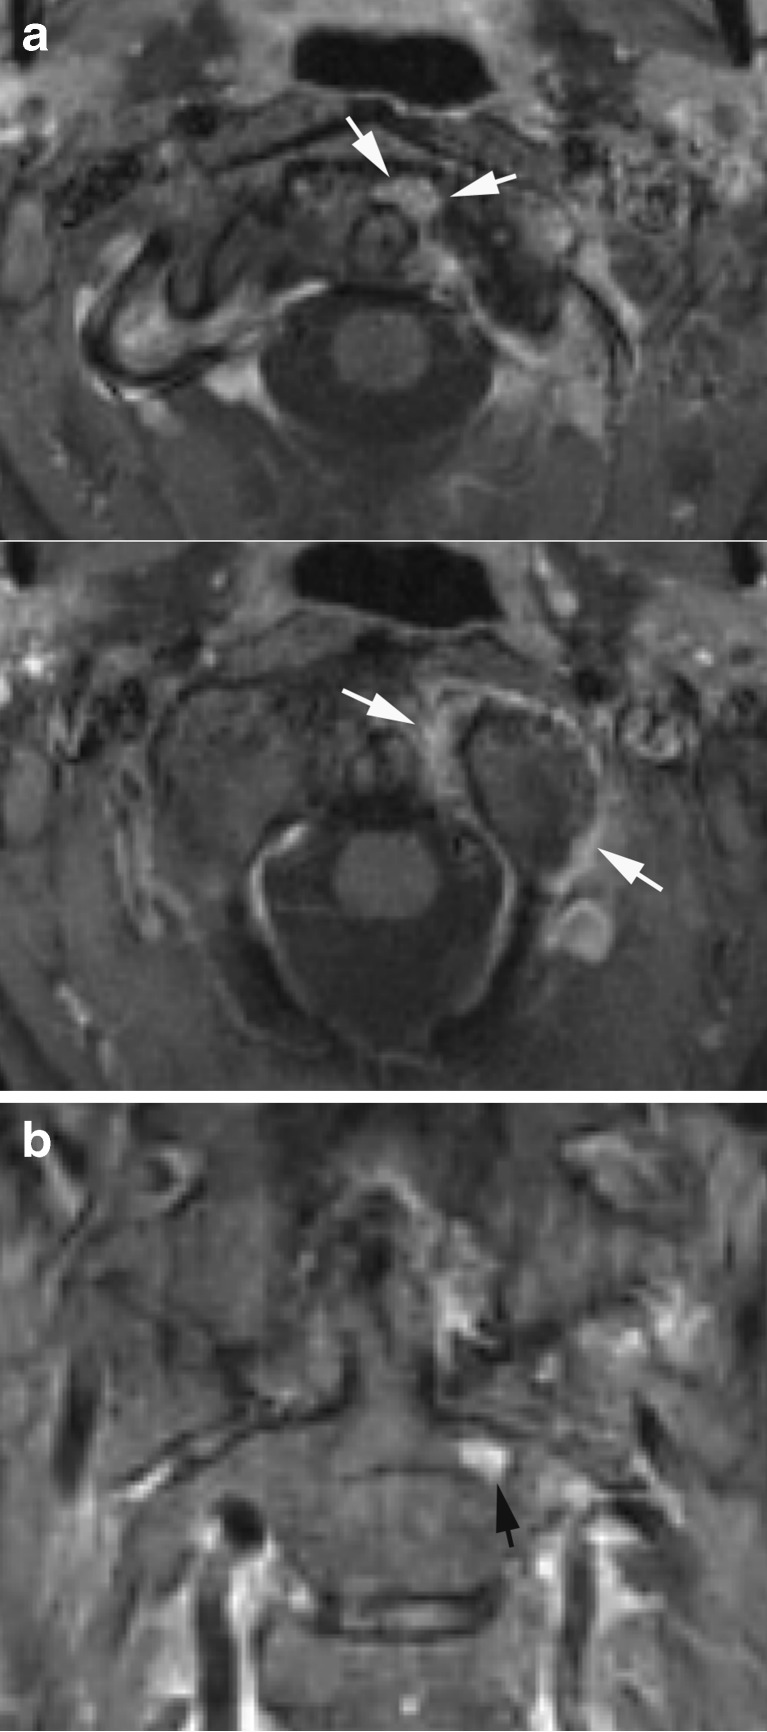
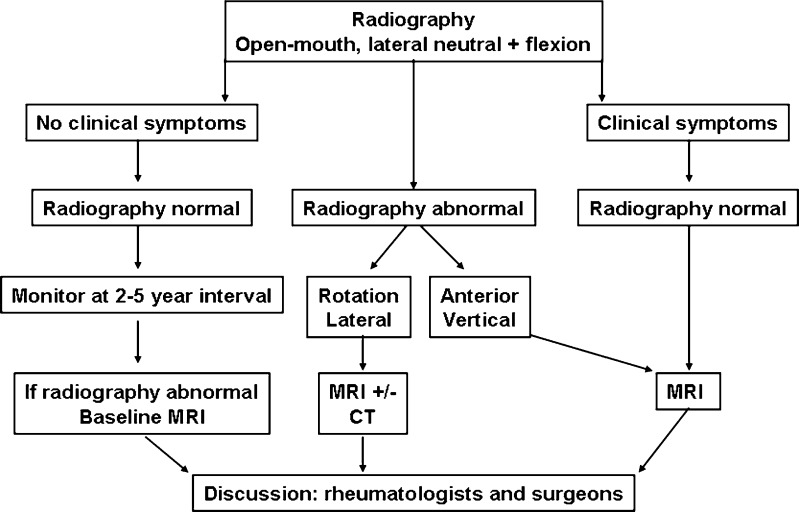
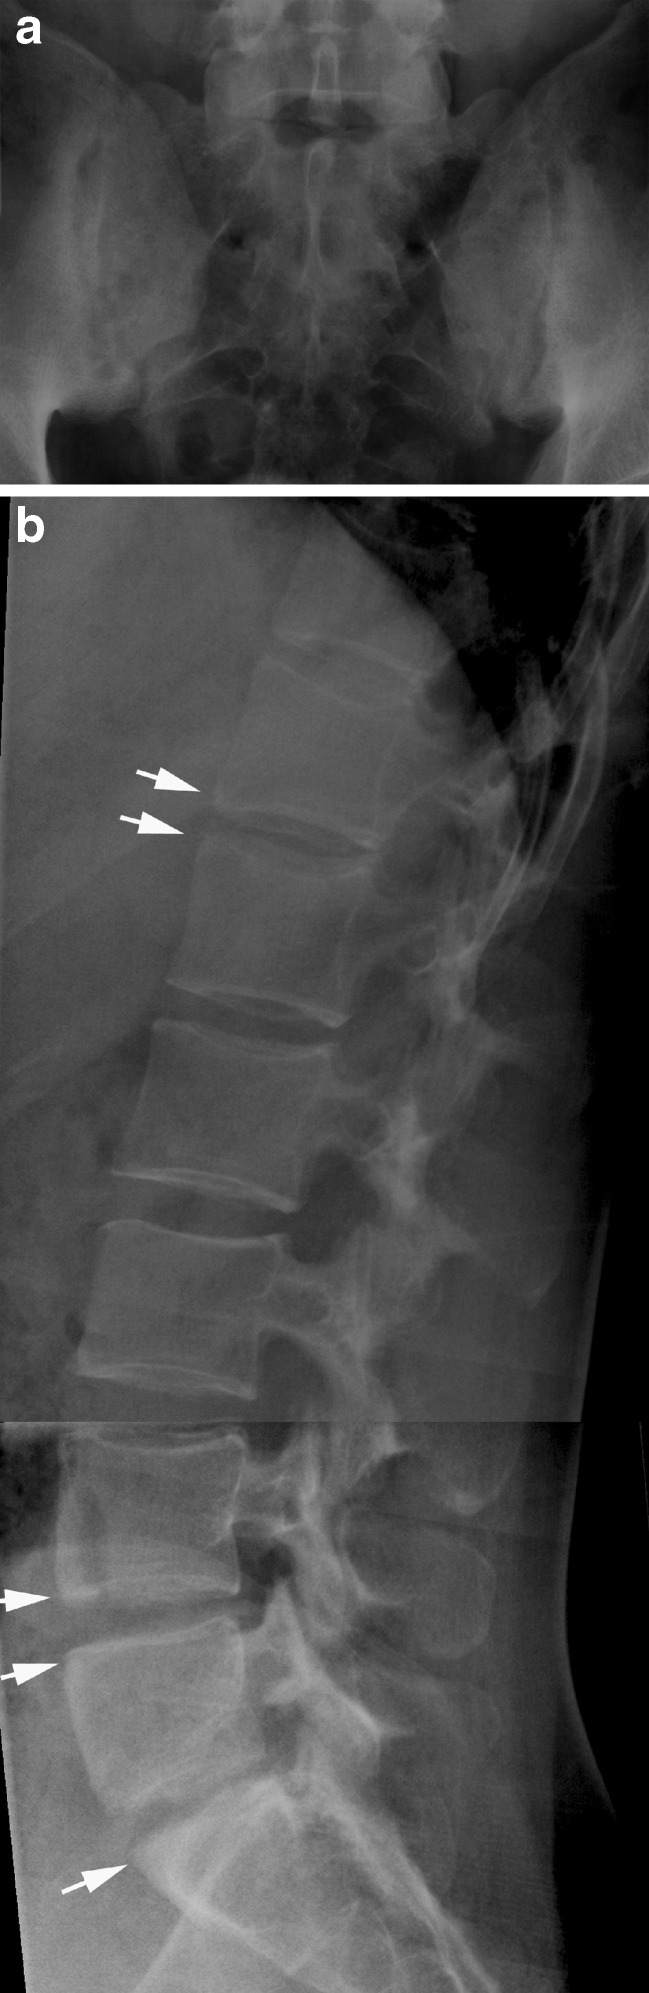
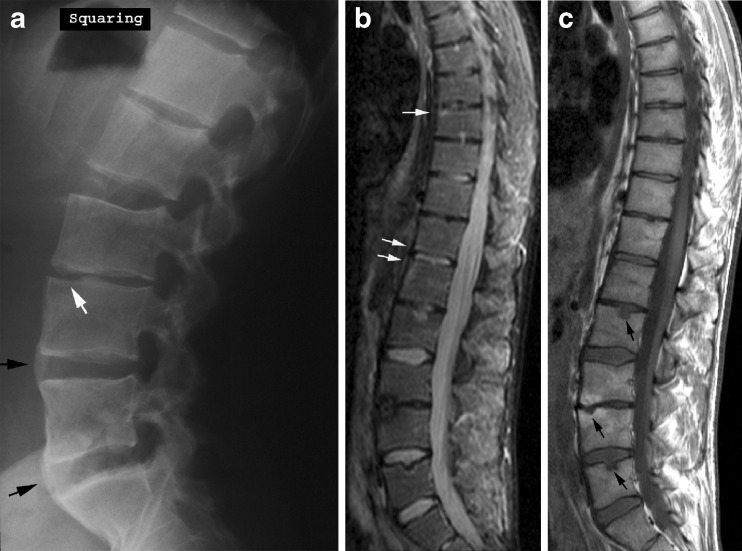
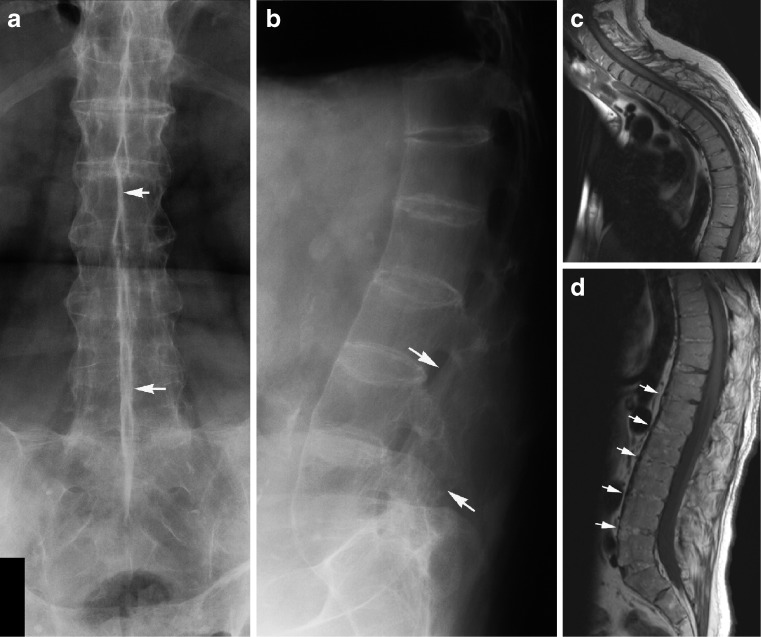
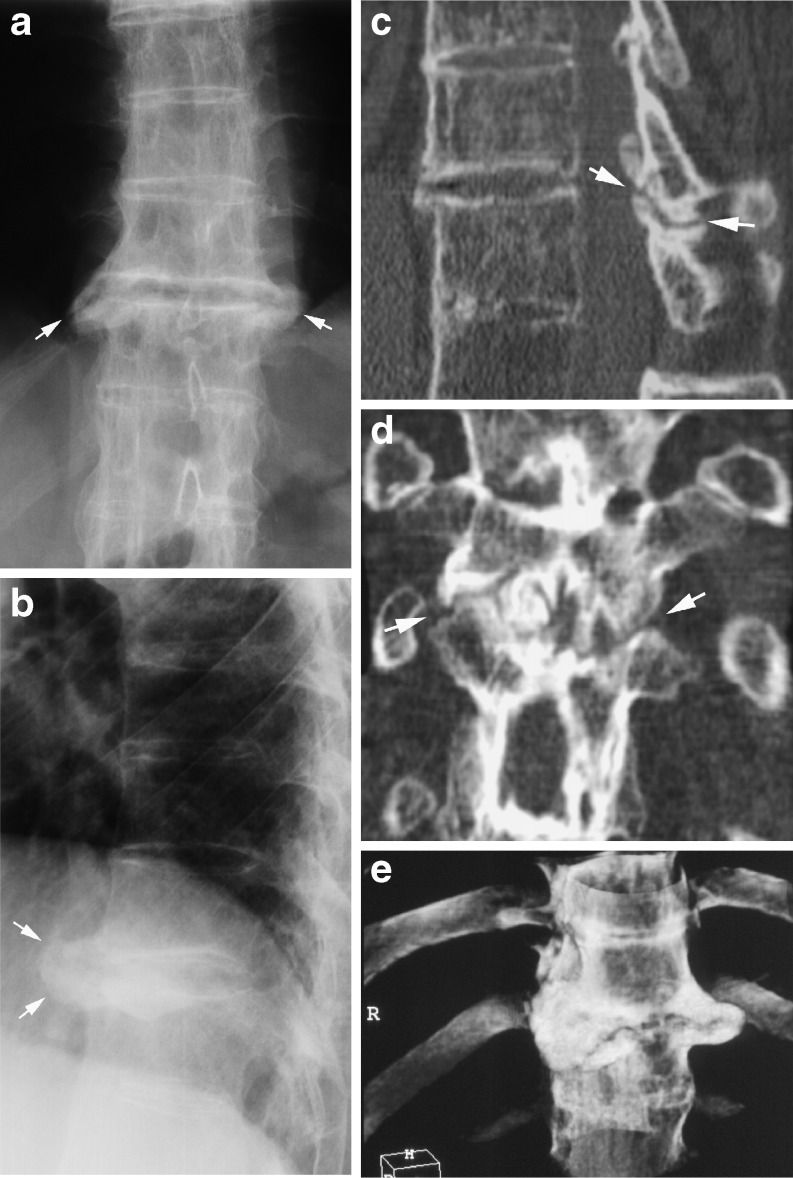
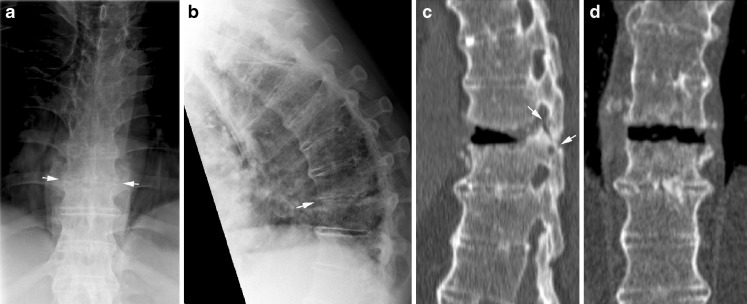
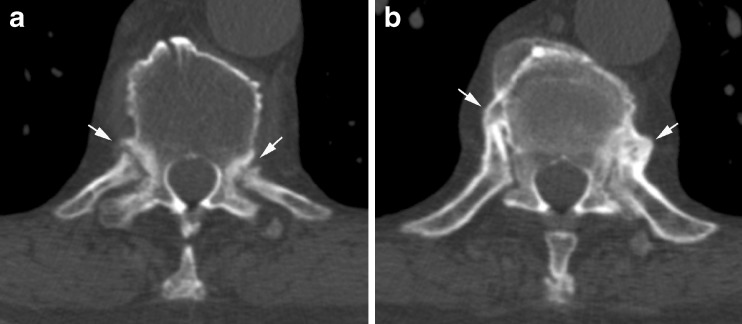
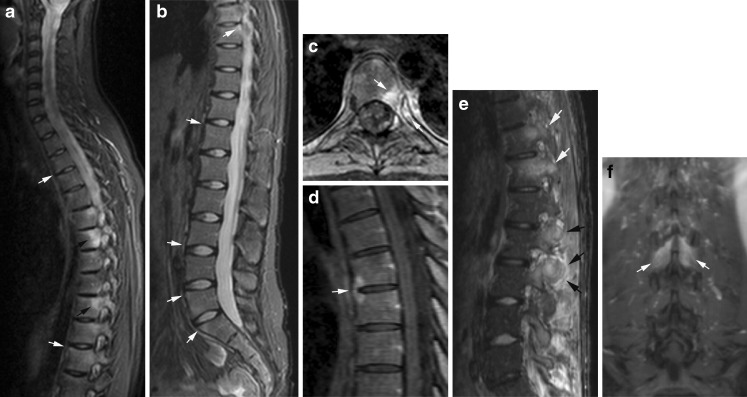
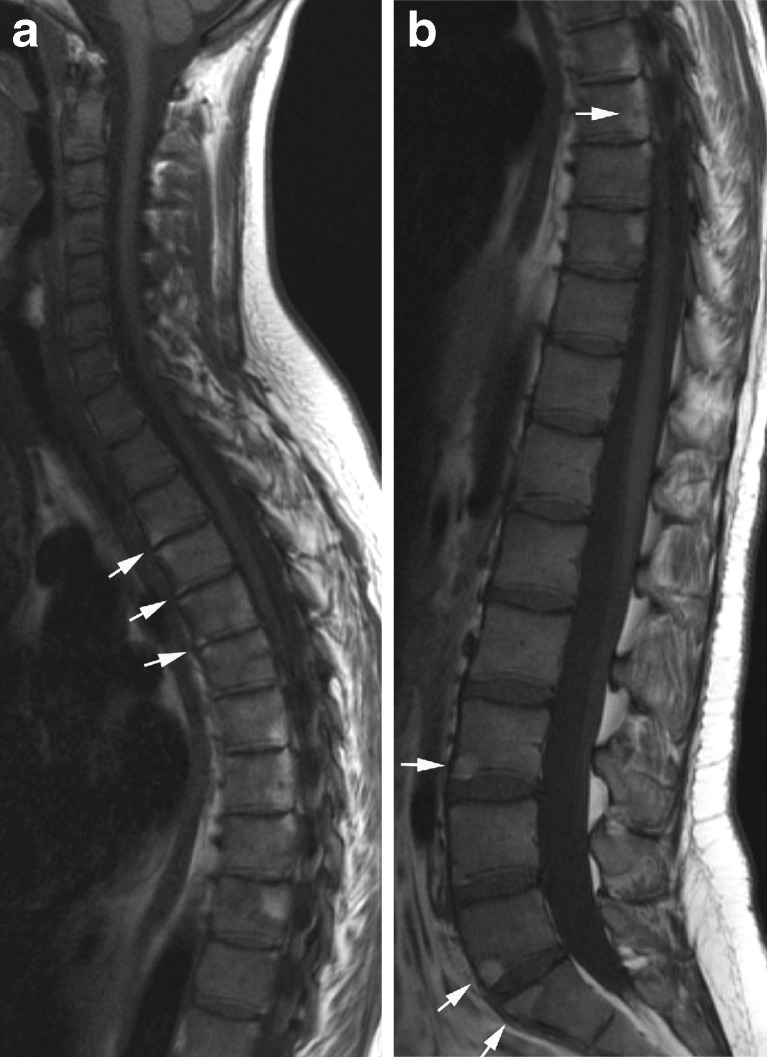
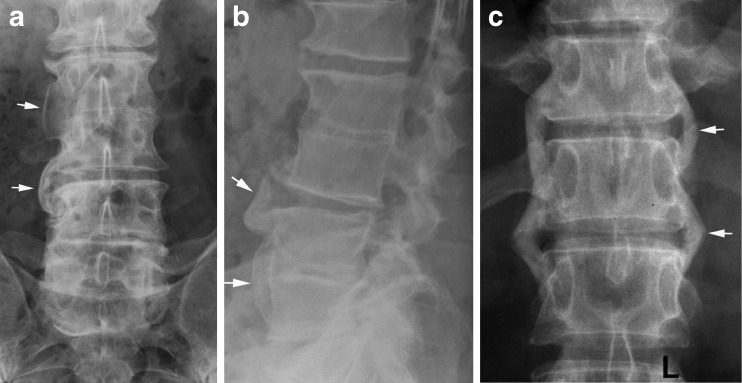
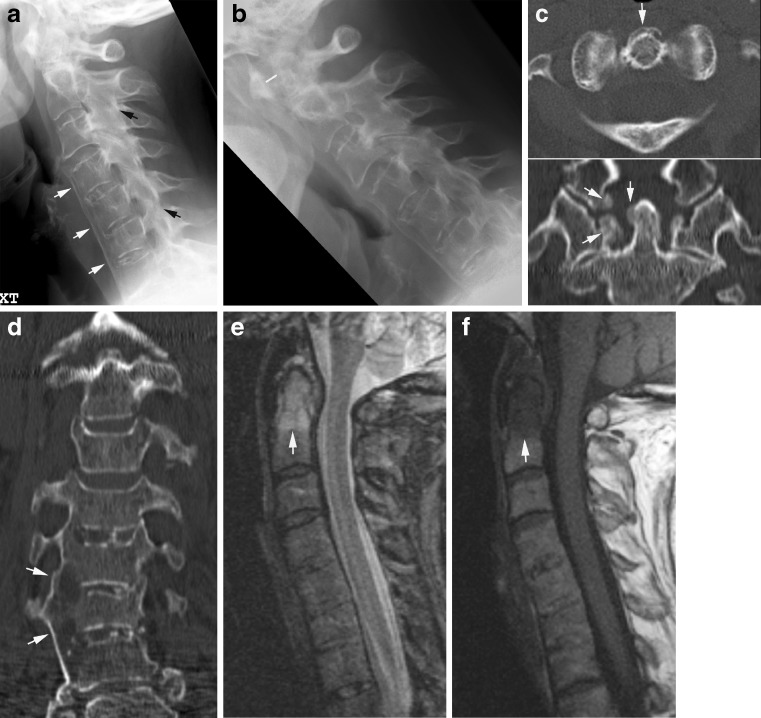
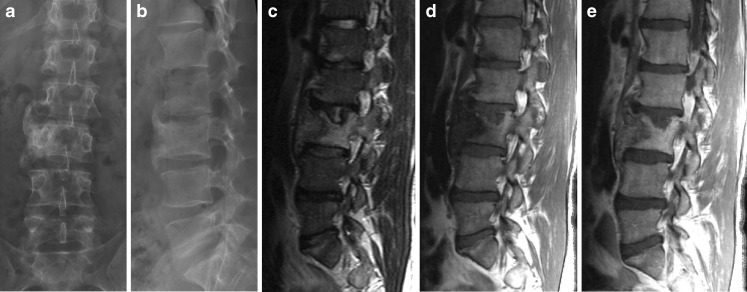
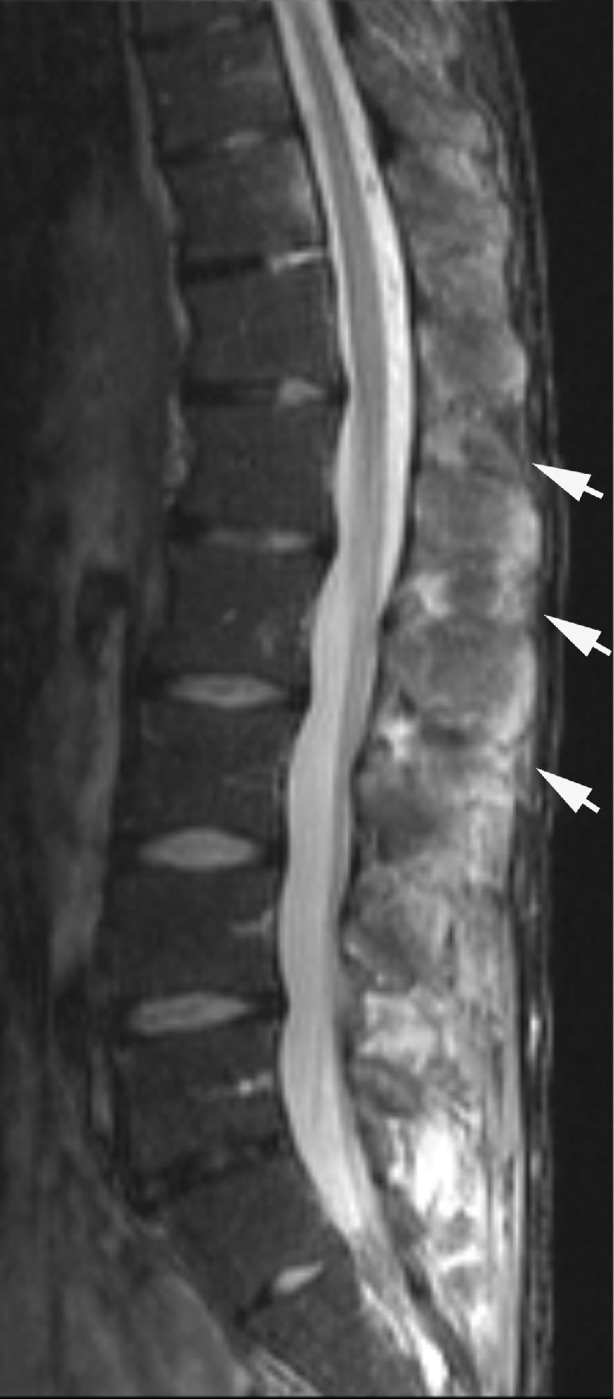
Spinal involvement is frequent in rheumatoid arthritis (RA) and seronegative spondyloarthritides (SpA), and its diagnosis is important. Thus, MRI and CT are increasingly used, although radiography is the recommended initial examination. The purpose of this review is to present the typical radiographic features of spinal changes in RA and SpA in addition to the advantages of MRI and CT, respectively. RA changes are usually located in the cervical spine and can result in serious joint instability. Subluxation is diagnosed by radiography, but supplementary MRI and/or CT is always indicated to visualise the spinal cord and canal in patients with vertical subluxation, neck pain and/or neurological symptoms. SpA may involve all parts of the spine. Ankylosing spondylitis is the most frequent form of SpA and has rather characteristic radiographic features. In early stages it is characterised by vertebral squaring and condensation of vertebral corners, in later stages by slim ossifications between vertebral bodies, vertebral fusion, arthritis/ankylosis of apophyseal joints and ligamentous ossification causing spinal stiffness. The imaging features of the other forms of SpA can vary, but voluminous paravertebral ossifications often occur in psoriatic SpA. MRI can detect signs of active inflammation as well as chronic structural changes; CT is valuable for detecting fracture.


Figures

Fig. 1
Fig. 1
Standard radiography of the cervical spine in rheumatoid arthritis (RA). (a) Lateral radiographs in neutral position and (b) during flexion in addition to (c) lateral and (d) anterior-posterior (AP) open-mouth view of the atlanto-axial region (45-year-old woman). The flexion view (b) shows abnormal distance (>3 mm) between the posterior aspect of the anterior arc of the atlas and the anterior aspect of the dens (black line). Note that the spino-laminar line of the atlas (arrow) does not align with that of the other vertebrae, confirming the presence of anterior subluxation, but there is no stenosis of the atlanto-axial canal; the posterior atlanto-dental interval (white line) is >14 mm. The open-mouth view (d) shows erosion at the base of the dens (arrow). (a) and (b) show concomitant disc degenerative changes at the C4–C6 level
Fig. 2
Fig. 2
Lateral and rotatory atlanto-axial subluxation. AP open-mouth view in a 53-year-old man with RA. There is narrowing of the atlanto-axial joints with superficial erosions (black arrow) and lateral displacement of the axis with respect to the lateral masses of the atlas (white arrow); in addition signs indicating rotatory displacement with asymmetry of the distance between the dens and the lateral masses of the atlas
Fig. 3
Fig. 3
Vertical atlanto-axial subluxation, measurement methods. (a) Lateral normal radiograph in neutral position showing the location of McGregor’s line (black) between the postero-superior aspect of the hard palate and the most caudal point of the occipital curve. Migration of the tip of the dens >4.5 mm above McGregor’s line indicates vertical subluxation. The distance indicated by the white line between McGregor’s line and the midpoint of the inferior margin of the body of axis is used to evaluate vertical subluxation according to Redlund-Johnell and Pettersson’s method. A distance less than 34 mm in men and 29 mm in women indicates vertical subluxation. (b) Sagittal CT reconstruction of a normal cervical spine showing the location of McRae’s line corresponding to the occipital foramen and the division of the axis into three equal portions used by Clark’s method for diagnosing vertical subluxation. If the anterior arc of the atlas is in level with the middle or caudal third of the axis there is slight and pronounced vertical subluxation, respectively. (c) Ranawat’s method includes determination of the distance between the centre of the second cervical pedicle and the transverse axis of the atlas. A distance less than 15 mm in males and 13 mm in females indicates vertical subluxation [4]
Fig. 4
Fig. 4
Vertical subluxation. (a) Lateral radiograph with McGregor’s line (black line; 61-year-old man with RA). The tip of the dens is difficult to define, but measurement according to Redlund-Johnell’s method (white line) results in a distance of 27 mm, which is below the normal limit. In accordance with this, the anterior arc of the atlas is level with the middle third of the axis. (b) Ranawat’s method, the distance between the centre of the second cervical pedicle and the transverse axis of the atlas is below the normal limit (9 mm). Thus, all measurements indicate vertical subluxation. Supplementary MRI, (c) sagittal STIR and (d) T1-weighted images show erosion of the dens and protrusion of the tip into the occipital foramen causing narrowing of the spinal canal to 9 mm, but persistence of cerebrospinal fluid around the cord. There is a 9-mm-thick mass of pannus tissue between the dens and anterior arc (black line) exhibiting small areas with high signal intensity on the STIR image (arrow) compatible with slight activity, but signal void fibrous pannus tissue predominates
Fig. 5
Fig. 5
Vertical subluxation with spinal cord compression. MRI of the cervical spine in a 69-year-old woman with advanced peripheral RA, neck pain and clinical signs of myelopathy. (a) Sagittal STIR, (b) sagittal T1 and (c) axial T2 fat-saturated (FS) images show erosion of the dens and protrusion of the tip into the occipital foramen causing compression of the spinal cord, which exhibits irregular signal intensity (white arrows). The osseous spinal canal has a width of approximately 7 mm (black line). There is heterogeneous signal intensity pannus surrounding the dens compatible with a mixture of fibrotic and oedematous pannus tissue (black arrows) in the widened space between the dens and the anterior arc of the atlas
Fig. 6
Fig. 6
Subaxial instability. (a) Flexion view in a 64-year-old woman with advanced peripheral RA showing anterior atlanto-axial instability as well as subaxial instability at multiple levels. (b) Flexion view 2 years later after surgical stabilisation of the atlanto-axial region demonstrates progression of the subaxial instability, especially between C3 and C4 (white arrow). There is a characteristic “stepladder” appearance, which also occurred on the initial radiographs (a), but is less pronounced
Fig. 7
Fig. 7
Advantages of CT and MRI. (a) Supplementary CT and (b-f) MRI of the patient shown in Fig. 1. CT demonstrates erosion not only at the base of the dens, but also at the tip and at the atlanto-axial and atlanto-occipital joints, which are difficult to visualise by radiography. MRI, (b) sagittal STIR and (c) sagittal T1 of the entire cervical spine and post-contrast T1FS images of the atlanto-axial region, (d) sagittal, (e) coronal and (f) axial. Oedematous voluminous pannus surrounding the dens is seen on the STIR and T1 images (black arrows) in addition to C4/5 and C5/6 disc degeneration with posterior protrusion of the disc at C4/5. The post-contrast T1FS images confirm the presence of vascularised enhancing pannus around the dens (white arrows) and demonstrate improved anatomical delineation compared with the STIR image. There is no sign of spinal cord compression
Fig. 8
Fig. 8
Non-radiographic MR findings. MRI in a 41-year-old woman with peripheral erosive RA and neck pain, but normal cervical radiography. (a) Post-contrast axial and (b) coronal TIFS images show signs of active arthritis with synovial contrast enhancement at the left atlanto-axial joint in addition to enhancing pannus tissue at the left side of the dens (white arrows). There is also a subchondral enhancing area in the axis (black arrow) compatible with a pre-erosive lesion
Fig. 9
Fig. 9
Diagnostic strategy. According to Younes et al. [3] radiography of the cervical spine is indicated in all RA patients with disease duration >2 years. It should at least include open-mouth and lateral views in neutral and flexed positions. Because of the occurrence of asymptomatic cervical involvement in 17% of RA patients, it is recommended to monitor patients with intervals of 2–5 years depending on positivity for the rheumatoid factor. MRI is indicated in patients with neurological deficit, radiographic instability, atlanto-axial impaction and subaxial stenosis. CT may add information in rotatory and lateral subluxation because of the possibility of secondary reconstruction in arbitrary planes and a clear visualisation of the atlanto-occipital joints [6]
Fig. 10
Fig. 10
Relatively early changes in ankylosing spondylitis (AS). (a) AP radiograph of the sacroiliac joints in a 28-year-old man presenting with typical definite bilateral AS sacroiliitis (grade 3) in the form of bilateral joint erosion accompanied by subchondral sclerosis. (b) Initial spinal changes consisting of erosion of vertebral corners (Romanus lesion) with vertebral squaring corresponding to Th11, Th12, L4 and L5 accompanied by condensation of the vertebral corners—shiny corners (arrows)
Fig. 11
Fig. 11
Syndesmophytes and erosions in AS. (a) Lateral radiograph in a 29-year-old man with the characteristic slim ossification (syndesmophytes) at the periphery of the annulus fibrosus (black arrows) in addition to erosion of the endplates at the intervertebral (iv) space between L3 and L4 (white arrow). Supplementary MRI, (b) sagittal STIR and (c) T1-weighted images show small oedematous areas in the erosion at iv L3/4 on the STIR image and surrounding fatty marrow deposition on T1 as a sign of previous osseous inflammation. There are additional erosive changes (black arrows, c) not clearly delineated by radiography and slight oedema at the vertebral corners (white arrows, b). Note that the syndesmophytes demonstrated by radiography are not visible on MRI
Fig. 12
Fig. 12
Advanced AS. (a) AP and (b) lateral radiograph in a 55-year-old man showing vertebral fusion due to syndesmophytes crossing the intervertebral spaces in addition to fusion of the apophyseal joints (bamboo spine). The interspinous ligaments are ossified, presenting as a slim ossified streak on the frontal radiograph (dagger sign; arrows). MRI, sagittal T1-weighted images of (c) the cervico-thoracic and (d) lumbar region, respectively, shows a general narrowing of the intervertebral discs with partial osseous fusion of the vertebral bodies, especially in the lumbar region (arrows). In addition a characteristic AS deformity with reduced lumbar lordosis and thoracic kyphosis
Fig. 13
Fig. 13
Pseudo-arthrosis-like changes in AS. (a) AP and (b) lateral radiograph showing vertebral fusion except at iv Th10/11. There is surrounding osteophyte formation at this iv space (arrows). Supplementary CT, (c) sagittal and (d) coronal 2D reconstruction, demonstrates lack of fusion of the vertebral bodies and apophyseal joints at this level (arrows). (e) 3D reconstruction clearly demonstrates the exuberant surrounding reactive osteophytes
Fig. 14
Fig. 14
Spinal fracture in AS. (a) AP and (b) lateral radiograph of the thoracic spine in a 64-year-old man with advanced AS and increasing back pain over 4 weeks. The lateral view demonstrates a slight malalignment at the anterior aspects of the vertebral bodies of Th9 and Th10, and the iv is irregularly narrowed on the AP view, all suggesting fracture (arrows). CT, (c) sagittal and (d) coronal reconstruction, shows fracture through the iv space and the posterior structures (arrows). There is widening of the intervertebral space anteriorly in the supine position used for CT compared with the upright position used during radiography
Fig. 15
Fig. 15
CT detection of costo-vertebral changes in AS. Axial CT slices showing erosive changes (a) and ankylosis of costo-vertebral joints (b), respectively (arrows)
Fig. 16
Fig. 16
Activity changes in AS by MRI. Sagittal STIR of (a) the cervico-thoracic and (b) the lumbar spine of the patients shown in Fig. 10 obtained 3 years before the radiography. There are multiple high signal intensity areas corresponding to vertebral corners (white arrows). Additionally, osseous oedema of the costo-vertebral joints (a, black arrows) seen on the lateral sagittal slice of the thoracic spine. (c) Axial post-contrast T1FS of an inflamed costo-vertebral joint confirmed the presence of joint inflammation in the form of osseous enhancement in both the vertebra and the rib (arrows) in addition to joint erosion. (d) Midline sagittal post-contrast T1FS shows an enhancing syndesmophyte. (e) Inflammatory changes at the apophyseal joint in a 27-year-old man; sagittal STIR image of the lumbar region showing subchondral osseous oedema in the lower thoracic region (white arrows), and both osseous and soft tissue oedema corresponding to the lumbar apophyseal joints (black arrows). Note that the osseous oedema in the pedicle of Th12 extends to the region of the costo-vertebral joint. (f) Coronal post-contrast T1FS of the lumbar spine shows additional enhancement corresponding to the interspinous ligament between L2 and L3 (arrows)
Fig. 17
Fig. 17
Chronic changes in AS by MRI. Sagittal T1 of (a) the cervico-thoracic and (b) the lumbar spine of the patients shown in Fig. 10. There are multiple fatty marrow depositions at vertebral corners and also posteriorly in thoracic vertebral bodies (b, arrows). This was observed to have developed since the MRI performed 3 years previously (shown in Fig. 16a-d) and corresponds to areas of previous inflammation
Fig. 18
Fig. 18
Psoriatic arthritis (PsA), paravertebral ossifications. (a) AP and (b) lateral radiograph of the lumbar spine in a 48-year-old man with PsA showing voluminous paravertebral new bone formation (arrows) in addition to fusion of the second and third vertebral bodies. There was no concomitant sacroiliitis. (c) AP radiograph of the thoraco-lumbar junction in a female patient with axial PsA demonstrating coalescing paravertebral ossifications (arrows)
Fig. 19
Fig. 19
Cervical PsA. (a) Lateral radiographs in the neutral position and (b) during flexion in a 61-year-old woman show atlanto-axial instability with a 4-mm distance between the anterior arc and the dens (white line). Additionally, ankylosis of the apophyseal joints (black arrows) and new bone formation anterior to the C4-7 vertebral bodies (white arrows). CT, (c) axial slice and coronal reconstruction of the dens area, demonstrates new bone formation in the atlanto-axial region (arrows); (d) coronal reconstruction of the lower cervical region shows voluminous new bone formation on the right side of the vertebral bodies (arrows). MRI, (e) sagittal STIR and (f) T1-weighted images, shows homogeneous osseous inflammation corresponding to the dens (arrows) with surrounding irregular oedema compatible with a mixture of osteitis and enthesitis. Note that the anterior new bone formation visualised by radiography is difficult to detect on MRI
Fig. 20
Fig. 20
Lumbar PsA. (a) AP and (b) lateral radiograph in a 50-year-old man show voluminous paravertebral ossifications anteriorly and at the right side of the third lumbar vertebra and adjacent iv spaces. MRI, (c) sagittal STIR, (d) T1 and (e) post-contrast T1-weighted images, demonstrates manifest osseous inflammation (osteitis) in the form of oedema and enhancement of the vertebral body, slight enhancement in the paravertebral new bone formation and erosion of the upper vertebral plate compatible with a mixture of osteitis, enthesitis and erosive changes
Fig. 21
Fig. 21
Enteropathic SpA. Sagittal STIR image of the lumbar spine in a 27-year-old man with ulcerative colitis demonstrates oedema corresponding to the interspinous ligaments (arrows) and spinous processes as signs of inflammation. There are only minimal activity changes corresponding to the vertebral bodies, located to the anterior vertebral corners

Similar articles

Cited by

References

    1. Paus AC, Steen H, Roislien J, Mowinckel P, Teigland J. High mortality rate in rheumatoid arthritis with subluxation of the cervical spine: a cohort study of operated and nonoperated patients. Spine. 2008;33(21):2278–2283. doi: 10.1097/BRS.0b013e31817f1a17. - DOI - PubMed
    1. Kim DH, Hilibrand AS. Rheumatoid arthritis in the cervical spine. J Am Acad Orthop Surg. 2005;13(7):463–474. - PubMed
    1. Younes M, Belghali S, Kriaa S, Zrour S, Bejia I, Touzi M, et al. Compared imaging of the rheumatoid cervical spine: prevalence study and associated factors. Joint Bone Spine. 2009;76(4):361–368. doi: 10.1016/j.jbspin.2008.10.010. - DOI - PubMed
    1. Riew KD, Hilibrand AS, Palumbo MA, Sethi N, Bohlman HH. Diagnosing basilar invagination in the rheumatoid patient. The reliability of radiographic criteria. J Bone Joint Surg Am. 2001;83(2):194–200. - PubMed
    1. Ishii K, Matsumoto M, Takahashi Y, Okada E, Watanabe K, Tsuji T, et al. Risk factors for development of subaxial subluxations following atlantoaxial arthrodesis for atlantoaxial subluxations in rheumatoid arthritis. Spine. 2010;35(16):1551–1555. doi: 10.1097/BRS.0b013e3181af0d85. - DOI - PubMed

LinkOut - more resources