

Why was the 2009 influenza pandemic in England so small?
- PMID: 22348001
- PMCID: PMC3277589
- DOI: 10.1371/journal.pone.0030223
Why was the 2009 influenza pandemic in England so small?
Abstract
The "Swine flu" pandemic of 2009 caused world-wide infections and deaths. Early efforts to understand its rate of spread were used to predict the probable future number of cases, but by the end of 2009 it was clear that these predictions had substantially overestimated the pandemic's eventual impact. In England, the Health Protection Agency made announcements of the number of cases of disease, which turned out to be surprisingly low for an influenza pandemic. The agency also carried out a serological survey half-way through the English epidemic. In this study, we use a mathematical model to reconcile early estimates of the rate of spread of infection, weekly data on the number of cases in the 2009 epidemic in England and the serological status of the English population at the end of the first pandemic wave. Our results reveal that if there are around 19 infections (i.e., seroconverters) for every reported case then the three data-sets are entirely consistent with each other. We go on to discuss when in the epidemic such a high ratio of seroconverters to cases of disease might have been detected, either through patterns in the case reports or through even earlier serological surveys.
Conflict of interest statement
Figures
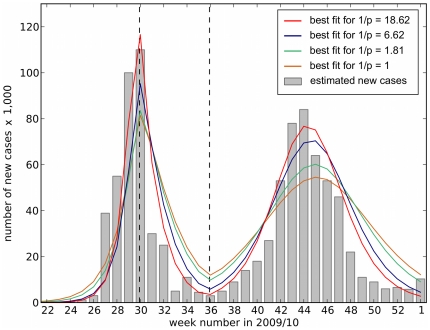
 representing reported cases. The initial conditions were set at the observed value of
  of the population immune before week 22. Four different values of parameter
  were assumed corresponding to four different fits:
  - brown line,
  - green line,
  - blue line and
  - red line. The figure illustrates that
  gives the best agreement between model and data with the smallest least square error, and allows our model to reproduce the case estimates. The fitting procedure yields estimates for the model's three parameters, shown in Table 2. Only when
  do these parameter estimates agree with previously published values, compare Table 2 with Tables 1, 3 and 4.
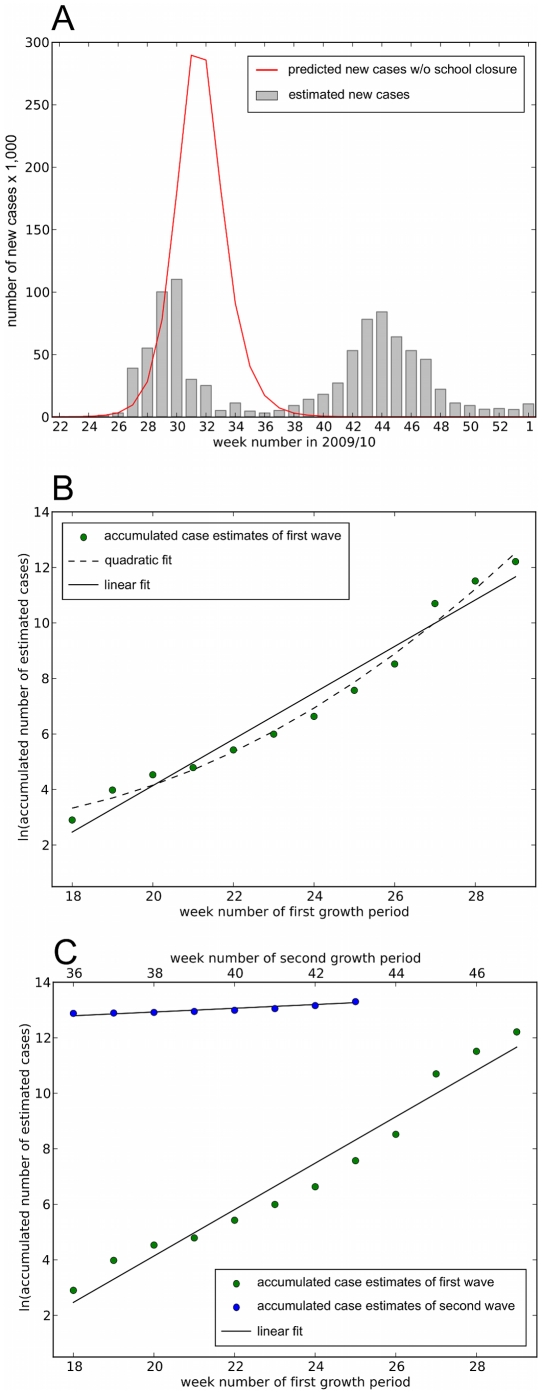
 and other parameters are the best fits for the model of equation (1)). B. This is confirmed in regression analyses of the natural logarithm of the cumulative number of cases. Data are filled circles, linear fit is the solid line and quadratic fit is the dashed line. Linear fit: ln(cumulative cases)
  . Quadratic fit: ln(cumulative cases)
  . The quadratic term is significant (
 ) but small and positive, signifying that, if anything, the epidemic was accelerating just before the schools broke up for summer. C. compares growth rates of the first wave (green dots) and second wave (blue dots). An analysis of covariance reveals that the two slopes are significantly different (
 ). Linear fit for second wave: ln(cumulative cases)
  .
.Similar articles
-
A new sentinel surveillance system for severe influenza in England shows a shift in age distribution of hospitalised cases in the post-pandemic period.PLoS One. 2012;7(1):e30279. doi: 10.1371/journal.pone.0030279. Epub 2012 Jan 23. PLoS One. 2012. PMID: 22291929 Free PMC article.
-
On Temporal Patterns and Circulation of Influenza Virus Strains in Taiwan, 2008-2014: Implications of 2009 pH1N1 Pandemic.PLoS One. 2016 May 3;11(5):e0154695. doi: 10.1371/journal.pone.0154695. eCollection 2016. PLoS One. 2016. PMID: 27139905 Free PMC article.
-
The influence of changing host immunity on 1918-19 pandemic dynamics.Epidemics. 2014 Sep;8:18-27. doi: 10.1016/j.epidem.2014.07.004. Epub 2014 Aug 8. Epidemics. 2014. PMID: 25240900
-
Ten lessons for the next influenza pandemic-an English perspective: a personal reflection based on community surveillance data.Hum Vaccin Immunother. 2012 Jan;8(1):138-45. doi: 10.4161/hv.8.1.18808. Epub 2012 Jan 1. Hum Vaccin Immunother. 2012. PMID: 22251996 Review.
-
The unusually diverse mortality patterns in the Pacific region during the 1918-21 influenza pandemic: reflections at the pandemic's centenary.Lancet Infect Dis. 2018 Oct;18(10):e323-e332. doi: 10.1016/S1473-3099(18)30178-6. Epub 2018 May 10. Lancet Infect Dis. 2018. PMID: 29754745 Review.
References
-
- Health Protection Agency. Weekly National Inuenza Reports. 2009. URL http://www.hpa.org.uk/web/HPAweb&HPAwebStandard/HPAweb_C/1244442494458.
-
- Anderson RM, May RM. Infectious Diseases of Humans: Dynamics and Control (Oxford Science Publications) Oxford: Oxford University Press; 1992. 768 URL http://www.amazon.co.uk/Infectious-Diseases-Humans-Dynamics-Publications....
-
- Scherer A, McLean AR. Mathematical models of vaccination. Br Med Bull. 2002;62:187–199. - PubMed
Publication types
MeSH terms
LinkOut - more resources
Full Text Sources
Medical
