

Indirect co-culture with tendons or tenocytes can program amniotic epithelial cells towards stepwise tenogenic differentiation
- PMID: 22348033
- PMCID: PMC3277591
- DOI: 10.1371/journal.pone.0030974
Indirect co-culture with tendons or tenocytes can program amniotic epithelial cells towards stepwise tenogenic differentiation
Abstract
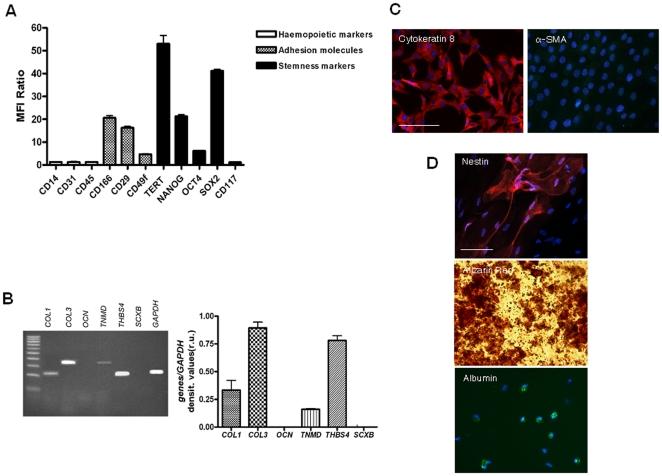
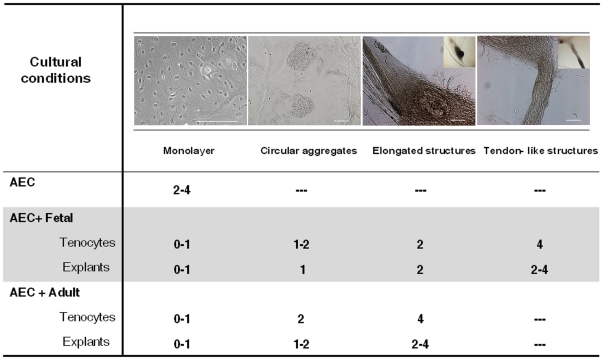
Background: Amniotic epithelial cells (AEC) have potential applications in cell-based therapy. Thus far their ability to differentiate into tenocytes has not been investigated although a cell source providing a large supply of tenocytes remains a priority target of regenerative medicine in order to respond to the poor self-repair capability of adult tendons. Starting from this premise, the present research has been designed firstly to verify whether the co-culture with adult primary tenocytes could be exploited in order to induce tenogenic differentiation in AEC, as previously demonstrated in mesenchymal stem cells. Since the co-culture systems inducing cell differentiation takes advantage of specific soluble paracrine factors released by tenocytes, the research has been then addressed to study whether the co-culture could be improved by making use of the different cell populations present within tendon explants or of the high regenerative properties of fetal derived cell/tissue.
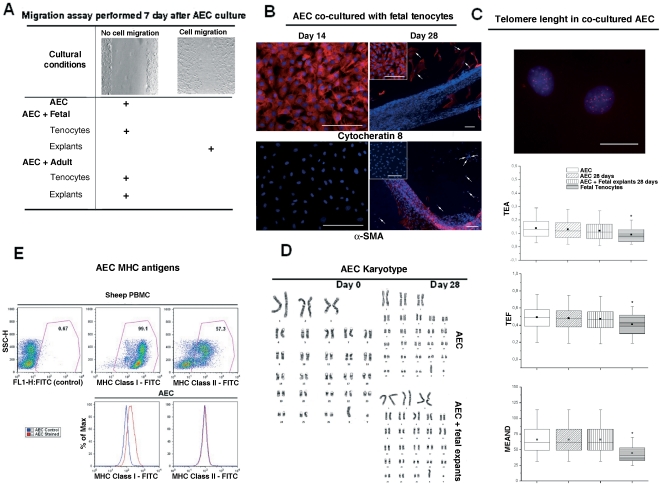
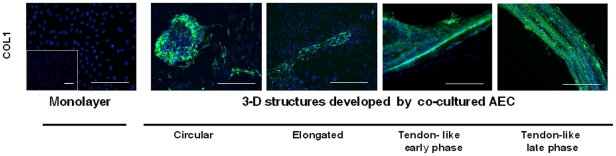
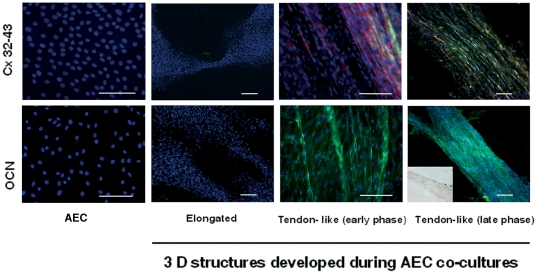
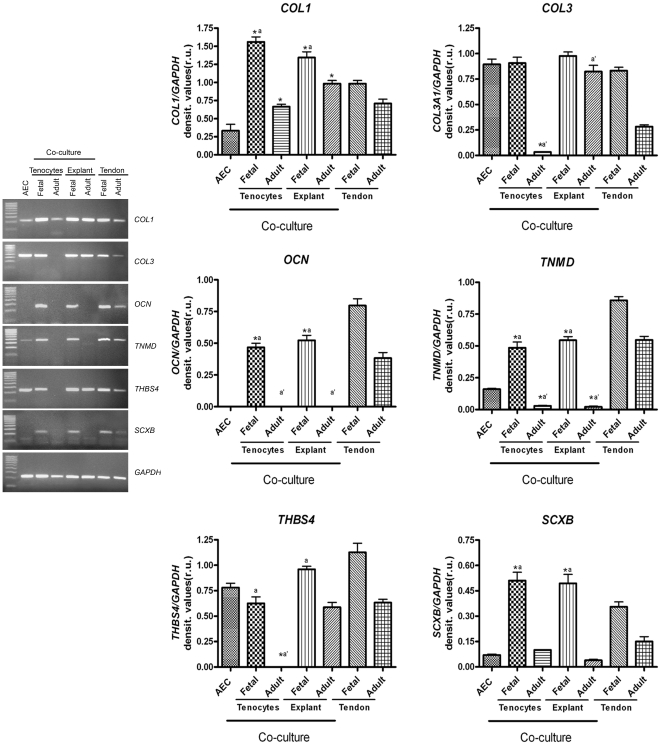
Methodology/principal findings: Freshly isolated AEC, obtained from ovine fetuses at mid-gestation, were co-incubated with explanted tendons or primary tenocytes obtained from fetal or adult calcaneal tendons. The morphological and functional analysis indicated that AEC possessed tenogenic differentiation potential. However, only AEC exposed to fetal-derived cell/tissues developed in vitro tendon-like three dimensional structures with an expression profile of matrix (COL1 and THSB4) and mesenchymal/tendon related genes (TNM, OCN and SCXB) similar to that recorded in native ovine tendons. The tendon-like structures displayed high levels of organization as documented by the cell morphology, the newly deposited matrix enriched in COL1 and widespread expression of gap junction proteins (Connexin 32 and 43).
Conclusions/significance: The co-culture system improves its efficiency in promoting AEC differentiation by exploiting the inductive tenogenic soluble factors released by fetal tendon cells or explants. The co-cultural system can be proposed as a low cost and easy technique to engineer tendon for biological study and cell therapy approach.
Conflict of interest statement
Figures
Similar articles
-
Tendon Biomimetic Electrospun PLGA Fleeces Induce an Early Epithelial-Mesenchymal Transition and Tenogenic Differentiation on Amniotic Epithelial Stem Cells.Cells. 2020 Jan 27;9(2):303. doi: 10.3390/cells9020303. Cells. 2020. PMID: 32012741 Free PMC article.
-
Electrospun PLGA Fiber Diameter and Alignment of Tendon Biomimetic Fleece Potentiate Tenogenic Differentiation and Immunomodulatory Function of Amniotic Epithelial Stem Cells.Cells. 2020 May 13;9(5):1207. doi: 10.3390/cells9051207. Cells. 2020. PMID: 32413998 Free PMC article.
-
Three-dimensional high-density co-culture with primary tenocytes induces tenogenic differentiation in mesenchymal stem cells.J Orthop Res. 2011 Sep;29(9):1351-60. doi: 10.1002/jor.21400. Epub 2011 Mar 15. J Orthop Res. 2011. PMID: 21437969
-
Tendon tissue engineering: Current progress towards an optimized tenogenic differentiation protocol for human stem cells.Acta Biomater. 2022 Jun;145:25-42. doi: 10.1016/j.actbio.2022.04.028. Epub 2022 Apr 22. Acta Biomater. 2022. PMID: 35470075 Review.
-
The Application of Photobiomodulation on Mesenchymal Stem Cells and its Potential Use for Tenocyte Differentiation.Curr Stem Cell Res Ther. 2025;20(3):232-245. doi: 10.2174/011574888X295488240319111911. Curr Stem Cell Res Ther. 2025. PMID: 38847377 Review.
Cited by
-
Molecular Mechanisms of Fetal Tendon Regeneration Versus Adult Fibrous Repair.Int J Mol Sci. 2021 May 25;22(11):5619. doi: 10.3390/ijms22115619. Int J Mol Sci. 2021. PMID: 34070692 Free PMC article.
-
Dose-Response Tendon-Specific Markers Induction by Growth Differentiation Factor-5 in Human Bone Marrow and Umbilical Cord Mesenchymal Stem Cells.Int J Mol Sci. 2020 Aug 17;21(16):5905. doi: 10.3390/ijms21165905. Int J Mol Sci. 2020. PMID: 32824547 Free PMC article.
-
IVM Advances for Early Antral Follicle-Enclosed Oocytes Coupling Reproductive Tissue Engineering to Inductive Influences of Human Chorionic Gonadotropin and Ovarian Surface Epithelium Coculture.Int J Mol Sci. 2023 Apr 1;24(7):6626. doi: 10.3390/ijms24076626. Int J Mol Sci. 2023. PMID: 37047595 Free PMC article.
-
Effect of scaffold morphology and cell co-culture on tenogenic differentiation of HADMSC on centrifugal melt electrospun poly (L‑lactic acid) fibrous meshes.Biofabrication. 2017 Nov 14;9(4):044106. doi: 10.1088/1758-5090/aa8fb8. Biofabrication. 2017. PMID: 29134948 Free PMC article.
-
Progesterone prevents epithelial-mesenchymal transition of ovine amniotic epithelial cells and enhances their immunomodulatory properties.Sci Rep. 2017 Jun 19;7(1):3761. doi: 10.1038/s41598-017-03908-1. Sci Rep. 2017. PMID: 28630448 Free PMC article.
References
-
- Sharma P, Maffulli N. Tendon injury and tendinopathy: healing and repair. J Bone Joint Surg Am. 2005;87(1):187–202. - PubMed
-
- Pennisi E. Tending tender tendons. Science. 2002;295(5557):1011. - PubMed
-
- Hampson K, Forsyth NR, Haj EI, Maffulli N. Ashammakhi N, Reis R, Chiellini, editors. Tendon tissue engineering. 2008. pp. 1–21. Topics in Tissue Engineering.
-
- Sharma P, Maffulli N. Biology of tendon injury: healing, modeling and remodeling. J Musculoskelet Neuronal Interact. 2006;6(2):181–190. - PubMed
-
- Wang JH. Mechanobiology of tendon. J Biomech. 2006;39(9):1563–1582. - PubMed
Publication types
MeSH terms
LinkOut - more resources
Full Text Sources
Miscellaneous
