. 2012;7(2):e31067.
doi: 10.1371/journal.pone.0031067. Epub 2012 Feb 13.

EGCG enhances the therapeutic potential of gemcitabine and CP690550 by inhibiting STAT3 signaling pathway in human pancreatic cancer

Affiliations

EGCG enhances the therapeutic potential of gemcitabine and CP690550 by inhibiting STAT3 signaling pathway in human pancreatic cancer

Su-Ni Tang et al. PLoS One. 2012.

Abstract

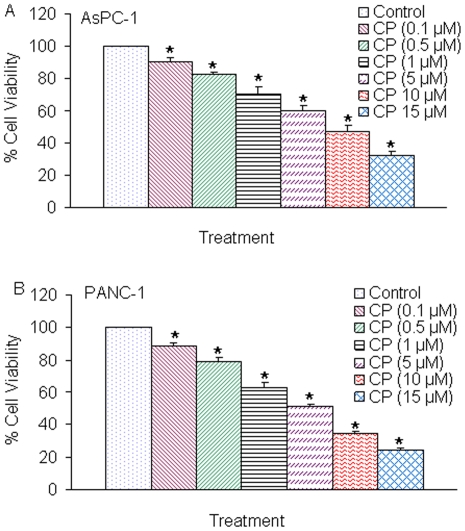
Background: Signal Transducer and Activator of Transcription 3 (STAT3) is an oncogene, which promotes cell survival, proliferation, motility and progression in cancer cells. Targeting STAT3 signaling may lead to the development of novel therapeutic approaches for human cancers. Here, we examined the effects of epigallocathechin gallate (EGCG) on STAT3 signaling in pancreatic cancer cells, and assessed the therapeutic potential of EGCG with gemcitabine or JAK3 inhibitor CP690550 (Tasocitinib) for the treatment and/or prevention of pancreatic cancer.

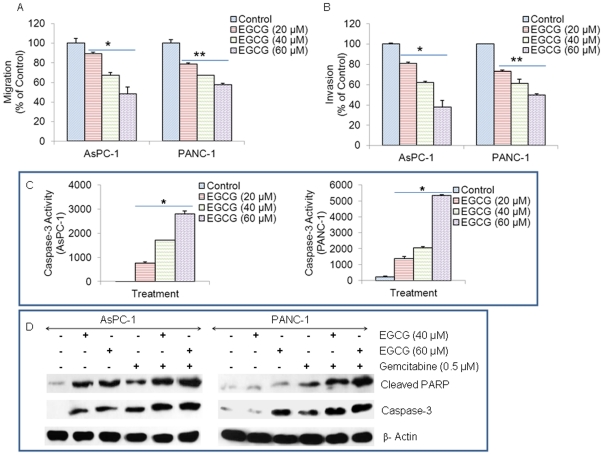
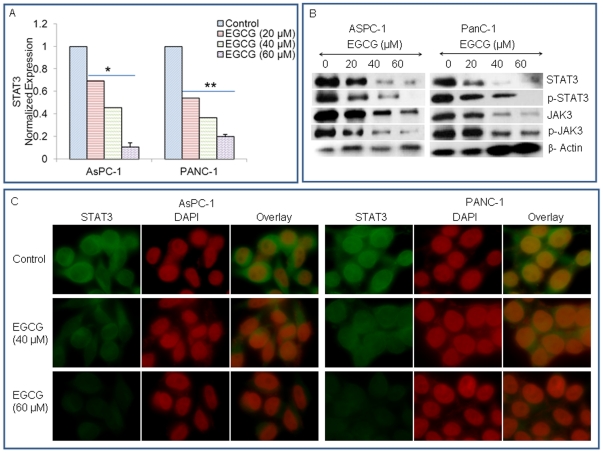
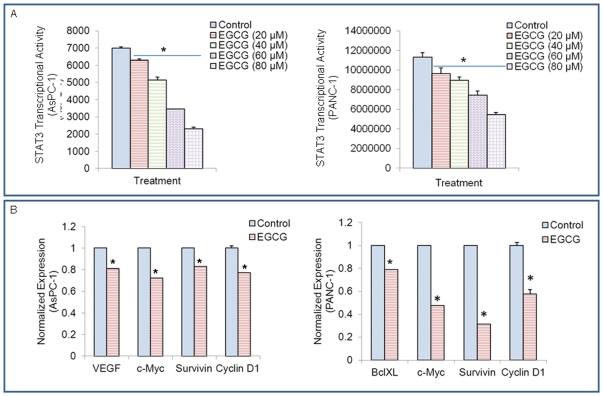
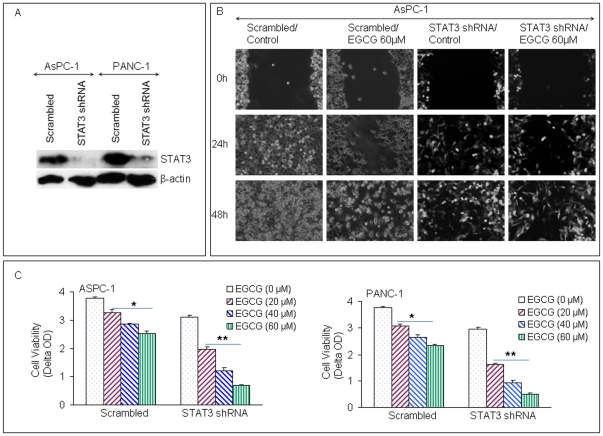
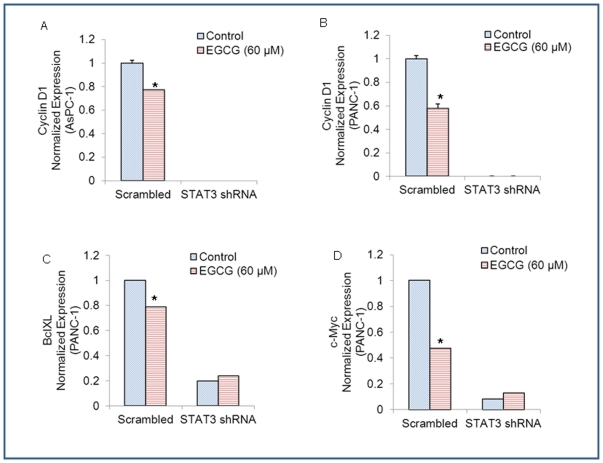
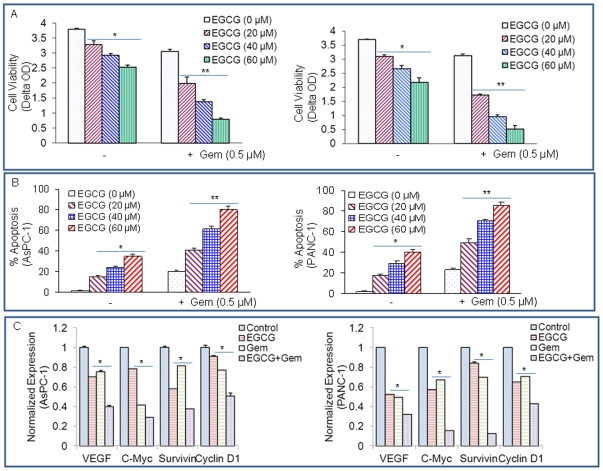
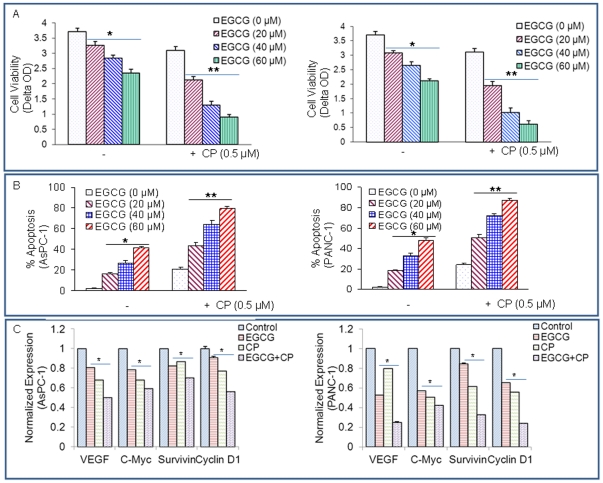
Methodology/principal findings: Cell viability and apoptosis were measured by XTT assay and TUNEL staining, respectively. Gene and protein expressions were measured by qRT-PCR and Western blot analysis, respectively. The results revealed that EGCG inhibited the expression of phospho and total JAK3 and STAT3, STAT3 transcription and activation, and the expression of STAT3-regulated genes, resulting in the inhibition of cell motility, migration and invasion, and the induction of caspase-3 and PARP cleavage. The inhibition of STAT3 enhanced the inhibitory effects of EGCG on cell motility and viability. Additionally, gemcitabine and CP690550 alone inhibited STAT3 target genes and synergized with EGCG to inhibit cell viability and induce apoptosis in pancreatic cancer cells.

Conclusions/significance: Overall, these results suggest that EGCG suppresses the growth, invasion and migration of pancreatic cancer cells, and induces apoptosis by interfering with the STAT3 signaling pathway. Moreover, EGCG further enhanced the therapeutic potential of gemcitabine and CP690550 against pancreatic cancer.


Conflict of interest statement

Competing Interests: The authors have declared that no competing interests exist.

Figures

Figure 1
Figure 1. Effects of EGCG on pancreatic cancer cells.
(A), Transwell migration assay. AsPC-1 and PANC-1 cells were plated in the top chamber of the transwell and treated with EGCG (0–60 µM) for 24 h. Cells migrated to the lower chambered were fixed with methanol, stained with crystal violet and counted. Data represent mean ± SD. * or ** = significantly different from respective controls, P<0.05. (B) Matrigel invasion assay. AsPC-1 and PANC-1 cells were plated onto the Matrigel-coated membrane in the top chamber of the transwell and treated with EGCG (0–60 µM) for 48 h. Cells invaded to the lower chamber were fixed with methanol, stained with crystal violet and counted. Data represent mean ± SD. * or ** = significantly different from respective controls, P<0.05. (C), Caspase-3 activity. AsPC-1 and PANC-1 cells were treated with EGCG (0–40 µM) for 48 h, and the caspase-3 activity was measured as per manufacturer's instructions (Invitrogen). Data represent mean ± SD. * = significantly different from respective controls, P<0.05. (D), AsPC-1 and PANC-1 cells were treated with EGCG (0–60 µM) with or without gemcitabine (0.5 µM) for 48 h. Cells were harvested and the Western blot analysis was performed to examine the expression of PARP and caspase-3. β-actin was used as a loading control. PARP antibody recognizes cleaved PARP, and caspase-3 antibody recognizes cleaved/active caspase-3.
Figure 2
Figure 2. EGCG inhibits JAK3/STAT3 pathway in pancreatic cancer.
(A), AsPC-1 and PANC-1 cells were treated with EGCG (0–60 µM) for 48 h, and the expression of STAT3 was measured by q-RT-PCR. Data represent mean ± SD. * or ** = significantly different from respective controls, P<0.05. (B), AsPC-1 and PANC-1 cells were treated with EGCG (0–60 µM) for 48 h. The expression of STAT3, p-STAT3, JAK3 and p-JAK3 was measured by Western blot analysis. β-actin was used as a loading control. (C), Expression of STAT3 in AsPC-1 and PANC-1 cells. Cells were treated with EGCG (0–60 µM) for 48 h. After incubation, the expression of STAT3 was measured by immunoflurescence. DAPI was used to stain nuclei. For better visuality, the color of DAPI was changed from blue to red. The green color represents the expression of STAT3. Red color = nuclei.
Figure 3
Figure 3. EGCG inhibits the expression of STAT3-regulated genes.
(A), STAT3 activity. AsPC-1 and PANC-1 cells were transfected with pGreenfire1-STAT3 reporter plasmid. Cells were treated with EGCG (0–80 µM). After incubation of 24 hours, luciferase activity was determined using the Dual-Luciferase Reporter Assay System, according the manufacturer's instructions on a multilabel plate reader. Data represent mean ± SD. * = significantly different from respective controls, P<0.05. (B), VEGF, Bcl-XL, c-Myc, Survivin and Cyclin D1 were detected by qRT-PCR. Data represent mean ± SD. * = significantly different from respective controls, P<0.05.
Figure 4
Figure 4. Inhibition of STAT3 enhances the inhibitory effects of EGCG on motility and cell viability of pancreatic cancer cells.
(A), AsPC-1 and PANC-1 were transfected with STAT3 shRNA. The expression of STAT3 was performed by Western blotting. (B), AsPC-1 scratch assay. AsPC-1 scrambled and STAT3 shRNA cells were cultured in 6 well dishes. The scratch was marked when the dishes were 50% confluent. Pictures were taken after the cells were treated with EGCG and incubated for 0, 24 and 48 h. (C), Cell viability assay. AsPC-1 and PANC-1 (scrambled and STAT3 shRNA) cells were seeded and treated with EGCG (0, 20, 40, 60 µM). After 72 h of treatment, cell viability was performed by XTT assay. Data represent mean ± SD. * or ** = significantly different from respective controls, P<0.05.
Figure 5
Figure 5. Effects of STAT3 shRNA on the regulation of cyclin D1, Bcl-XL and c-Myc by EGCG.
(A), AsPC-1/scrambled and AsPC-1/STAT3 shRNA cells were treated with or without EGCG (60 µM) for 48 h. The expression of cyclin D1 was measured by q-RT-PCR. Data represent mean ± SD. * = significantly different from respective controls, P<0.05. (B), PANC-1/scrambled and PANC-1/STAT3 shRNA cells were treated with or without EGCG (60 µM) for 48 h. The expression of cyclin D1 was measured by q-RT-PCR. Data represent mean ± SD. * = significantly different from respective controls, P<0.05. (C), PANC-1/scrambled and PANC 1/STAT3 shRNA cells were treated with or without EGCG (60 µM) for 48 h. The expression of Bcl-XL was measured by qRT-PCR. Data represent mean ± SD. * = significantly different from respective controls, P<0.05. (D), PANC-1/scrambled and PANC-1/STAT3 shRNA cells were treated with or without EGCG (60 µM) for 48 h. The expression of c-Myc was measured by q-RT-PCR. Data represent mean ± SD. * = significantly different from respective controls, P<0.05.
Figure 6
Figure 6. EGCG and gemcitabine inhibit cell viability and STAT3 target genes.
(A), AsPC-1 and PANC-1 cells were treated with EGCG (0, 20, 40, 60 µM) with or without gemcitabine (0.5 µM) for 72 h. Cell viability was measured by XTT assay. Data represent mean ± SD. * or ** = significantly different from respective controls, P<0.05. (B), AsPC-1 and PANC-1 cells were treated with EGCG (0, 20, 40, 60 µM) with or without gemcitabine (0.5 µM) for 72 h. Apoptosis was measured by TUNEL assay. Data represent mean ± SD. * or ** = significantly different from respective controls, P<0.05. (C), Inhibition of STAT3 target genes by EGCG and gemcitabine. AsPC-1 and PANC-1 cells were treated with EGCG (20 µM) or gemcitabine (0.5 µM) for 48 h. The expression of VEGF, c-Myc, survivin and cyclin D1was was measured by qRT-PCR. Data represent mean ± SD. * = significantly different from respective controls, P<0.05.
Figure 7
Figure 7. CP690550 inhibits cell viability of AsPC-1 and PANC-1 cells.
(A), AsPC-1 cells were seeded in 96 well plates at 4×10⁴ cells per well and treated with CP690550 (0–15 µM) for 72 h. Cell viability was measured by XTT assay. Data represent mean ± SD. * = significantly different from control, P<0.05. (B), PANC-1 cells were seeded in 96 well plates at 4×10⁴ cells per well and treated with CP690550 (0–15 µM) for 72 h. Cell viability was measured by XTT assay. Data represent mean ± SD. * = significantly different from control, P<0.05.
Figure 8
Figure 8. EGCG and CP690550 inhibit cell viability and STAT3 target genes.
(A), AsPC-1 and PANC-1 cells were treated with EGCG (0, 20, 40, 60 µM) with or without CP690550 (0.5 µM) for 72 h. Cell viability was measured by XTT assay. Data represent mean ± SD. * or ** = significantly different from respective controls, P<0.05. (B), AsPC-1 and PANC-1 cells were treated with EGCG (0, 20, 40, 60 µM) with or without CP690550 (0.5 µM) for 72 h. Apoptosis was measured by TUNEL assay. Data represent mean ± SD. * or ** = significantly different from respective controls, P<0.05. (C), Inhibition of STAT3 target genes by EGCG and CP690550. AsPC-1 and PANC-1 cells were untreated or treated with EGCG (20 µM) or CP690550 (0.5 µM) for 48 h. The expression of VEGF, c-Myc, survivin and cyclin D1 was measured by qRT-PCR. Data represent mean ± SD. * = significantly different from respective controls, P<0.05.

Similar articles

Cited by

References

    1. Schindler C, Darnell JE. Transcriptional Responses to Polypeptide Ligands: The JAK-STAT Pathway. Annual Review of Biochemistry. 1995;64:621–652. - PubMed
    1. Darnell J, Kerr I, Stark G. Jak-STAT pathways and transcriptional activation in response to IFNs and other extracellular signaling proteins. Science. 1994;264:1415–1421. - PubMed
    1. Darnell JE. STATs and Gene Regulation. Science. 1997;277:1630–1635. - PubMed
    1. Darnell JE., Jr Transcription factors as targets for cancer therapy. Nat Rev Cancer. 2002;2:740–749. - PubMed
    1. Berishaj M, Gao SP, Ahmed S, Leslie K, Al-Ahmadie H, et al. Stat3 is tyrosine-phosphorylated through the interleukin-6/glycoprotein 130/Janus kinase pathway in breast cancer. Breast Cancer Res. 2007;9:R32. - PMC - PubMed

Publication types

MeSH terms