. 2012;7(2):e31150.
doi: 10.1371/journal.pone.0031150. Epub 2012 Feb 10.

Proteome adaptation to high temperatures in the ectothermic hydrothermal vent Pompeii worm

Affiliations

Proteome adaptation to high temperatures in the ectothermic hydrothermal vent Pompeii worm

Didier Jollivet et al. PLoS One. 2012.

Abstract

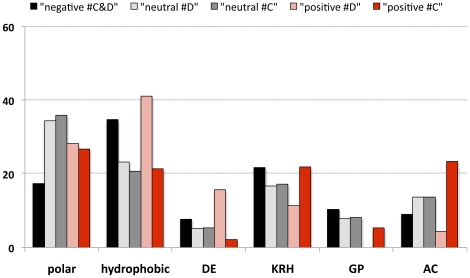
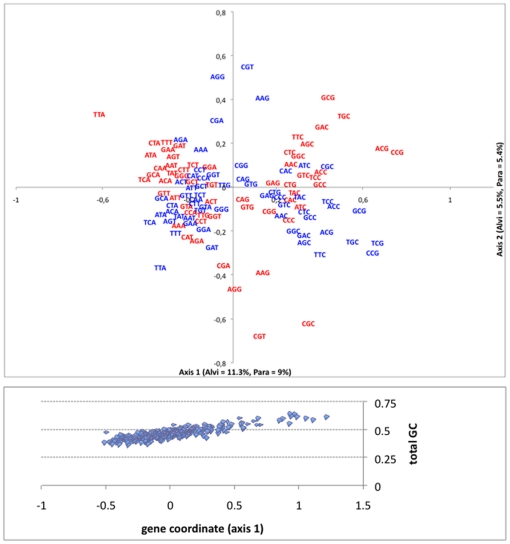
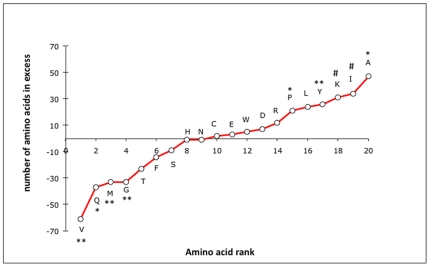
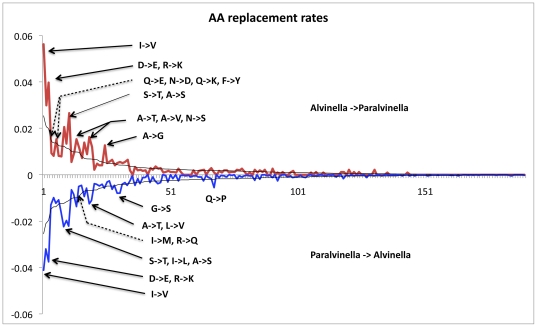
Taking advantage of the massive genome sequencing effort made on thermophilic prokaryotes, thermal adaptation has been extensively studied by analysing amino acid replacements and codon usage in these unicellular organisms. In most cases, adaptation to thermophily is associated with greater residue hydrophobicity and more charged residues. Both of these characteristics are positively correlated with the optimal growth temperature of prokaryotes. In contrast, little information has been collected on the molecular 'adaptive' strategy of thermophilic eukaryotes. The Pompeii worm A. pompejana, whose transcriptome has recently been sequenced, is currently considered as the most thermotolerant eukaryote on Earth, withstanding the greatest thermal and chemical ranges known. We investigated the amino-acid composition bias of ribosomal proteins in the Pompeii worm when compared to other lophotrochozoans and checked for putative adaptive changes during the course of evolution using codon-based Maximum likelihood analyses. We then provided a comparative analysis of codon usage and amino-acid replacements from a greater set of orthologous genes between the Pompeii worm and Paralvinella grasslei, one of its closest relatives living in a much cooler habitat. Analyses reveal that both species display the same high GC-biased codon usage and amino-acid patterns favoring both positively-charged residues and protein hydrophobicity. These patterns may be indicative of an ancestral adaptation to the deep sea and/or thermophily. In addition, the Pompeii worm displays a set of amino-acid change patterns that may explain its greater thermotolerance, with a significant increase in Tyr, Lys and Ala against Val, Met and Gly. Present results indicate that, together with a high content in charged residues, greater proportion of smaller aliphatic residues, and especially alanine, may be a different path for metazoans to face relatively 'high' temperatures and thus a novelty in thermophilic metazoans.


Conflict of interest statement

Competing Interests: The authors have declared that no competing interests exist.

Figures

Figure 1
Figure 1. Distribution of eukaryotic species according to the hydrophobic and charged residues signature of ribosomal proteins.
Amino acid composition of ribosomal proteins obtained using a concatenated set of 48 primary orthologous sequences (5191 site patterns) using lophotrochozoan and model species. Alvine (red circle), lophotrochozoan species (Capite, Helobd, Lumbri, Argope, Crasso: white circles), model organisms (Strong, Bfloridae, Dmelano, Celegans: grey circles), and Homo sapiens (Hsapiens: black circle). The X-axis represents the hydrophobic index W and the Y-axis corresponds to the percentage of charged residues. Bars are standard deviations estimated from 100 re-arrangements (bootstrap) of the dataset. For species name abbreviations, see Materials and Methods.
Figure 2
Figure 2. Distribution of eukaryotic species according to their expected GC-content background.
(A) Linear regression and confidence interval (99%) of GARP and FYMINK residues and (B) relationship between GC3 and GC1+2 content for the same species as in Figure 1 (A. pompejana = red circle, lophotrochozoan species = white circles, model species = grey circles). Bars represent standard deviations estimated from 100 re-arrangements (bootstrap) of the dataset.
Figure 3
Figure 3. Maximum likelihood dN tree of lophotrochozoan invertebrates, including alvinellids and selective pressures among branches.
The tree was obtained from a concatenated set of ribosomal protein orthologous sequences using the ProtML programme of PHYLIP with dN branches subsequently optimized by fitting the codon dataset on the Goldman & Yang (1994) codon substitution model using the free-ω ratio model implemented in CodeML. Branch length (above the branch), and ω (below the branch) obtained from the free-ratio M1 model together with the number of positive codon sites with a BEB p-value>0.90 obtained from the M2A model.
Figure 4
Figure 4. Evolution of amino acid replacements within branches leading to the polychaete and alvinellid lineages.
Bars represent the proportions of polar, hydrophobic, charged and small residues found in the 3 ω categories when applying the selective branch-site model onto the codon dataset with the user tree shown in Figure 3. ω≪1 (black bar), ω = 1 (grey bars) and ω>1 (red bars) classes. Light- and dark-red colored bars represent positively selected sites in the internal branches leading to the polychaete (#D) and alvinellid (#C) lineages, respectively and light- and dark-grey colored bars represent sites behaving neutrally within the same branches.
Figure 5
Figure 5. Correspondance analysis (CA) of codon usage in alvinellid polychaetes.
CA was performed using Codon W software from a series of 335 orthologous sequences between A. pompejana and P. grasslei. A: Distribution of codons for both species (red = A. pompejana and blue = P. grasslei) obtained from two independant runs and displayed in mirror (sign inversion) along axis 2 for greater clarity. The graph shows a clear separation of GC-terminated and AT-terminated codons along axis 1. B: Distribution of genes along the CA axis 1 according to their total GC content.
Figure 6
Figure 6. Observed number of residue changes between the two alvinellid species using 335 orthologous genes.
Differences in the number of residues are ranked among the 20 amino-acid classes using the 2844 oriented (ParalvinellaAlvinella) amino acid replacements between the 2 alvinellid species. Binomial tests were performed between observed amino acid counts and their expected values under the assumption of no directional replacements: # = p<0.10, * = p<0.05, and ** = p<0.01.
Figure 7
Figure 7. Observed and expected distributions of oriented amino-acid substitutions between P. grasslei and A. pompejana.
Detection of amino acid substitutions that significantly depart from the neutral expectations of the WAG matrix. Blue and red lines correspond to the observed directional frequencies of residue replacements (eg. A→G and G→A) observed between the two alvinellid species. The black lines correspond to the expected directional frequencies of amino acid substitutions obtained using the WAG matrix multiplied by amino-acid frequencies typifying the two alvinellid worms. Arrows show ‘outlier’ substitutions that significantly depart from neutral evolution using the Normal distribution of differences at a 5% threshold.
Figure 8
Figure 8. Expected structural effect of the 305 residue replacements found between the two alvinellid species in ribosomal proteins.
Putative positive (blue bar), neutral (green bar) or negative (red bar) effect in terms of solvant exposure and charge modification on the 3D predicted structure of the 49 complete orthologous ribosomal proteins retrieved from the two alvinellid species. Replacements have been categorized into (above) conservative (i.e. polar to polar or apolar to apolar) and (below) non-conservative changes (i.e. polar to apolar or apolar to polar). Positive or negative effect was defined following three criteria: the level of residue burial when exposed or buried in the protein, the formation of hydrogen bonds and the formation of electrostatic bonds or exposed charges. (Above) Distribution of conservative changes from P. grasslei to A. pompejana between apolar, polar and charged residues. In the apolar category, positive = increase of the residue volume, negative = decrease of the residue volume and neutral = no volume change. In the charged and polar categories, positive = bond addition and negative = bond removal. (Below) Distribution of non conservative changes from P. grasslei to A. pompejana in terms of residue burial, hydrogen bonds, electrostatic bonds and solvation (positive: buried at a buried position or exposed at an exposed position, addition of hydrogen or electrostatic bonds, charged at exposed positions, negative: buried at an exposed position or exposed at a buried position, removal of bonds).

Similar articles

Cited by

References

    1. Haney PJ, Badger JH, Buldak GL, Reich CI, Woese CR, et al. Thermal adaptation analyzed by comparison of protein sequences from mesophilic and extremely thermophilic Methanococcus species. Proc Natl Acad Sci USA. 1999;96:3578–3583. - PMC - PubMed
    1. Kreil DP, Ouzounis CA. Identification of thermophilic species by the amino acid compositions deduced from their genomes. Nucleic Acids Res. 2001;29:1608–1615. - PMC - PubMed
    1. Berezovsky IN, Shakhnovich EI. Physics and evolution of thermophilic adaptation. Proc Natl Acad Sci USA. 2005;102:12742–12747. - PMC - PubMed
    1. Lynn DJ, Singer GAC, Hickey DA. Synonymous codon usage is subject to selection in thermophilic bacteria. Nucleic Acids Res. 2002;30:4272–4277. - PMC - PubMed
    1. Galtier N, Lobry JR. Relationships between genomic G+C content, RNA secondary structures and optimal growth temperature in prokaryotes. J Mol Biol. 1997;44:632–636. - PubMed

Publication types