Analysis of the fibroblast growth factor system reveals alterations in a mouse model of spinal muscular atrophy
- PMID: 22348054
- PMCID: PMC3278439
- DOI: 10.1371/journal.pone.0031202
Analysis of the fibroblast growth factor system reveals alterations in a mouse model of spinal muscular atrophy
Abstract
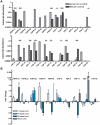
The monogenetic disease Spinal Muscular Atrophy (SMA) is characterized by a progressive loss of motoneurons leading to muscle weakness and atrophy due to severe reduction of the Survival of Motoneuron (SMN) protein. Several models of SMA show deficits in neurite outgrowth and maintenance of neuromuscular junction (NMJ) structure. Survival of motoneurons, axonal outgrowth and formation of NMJ is controlled by neurotrophic factors such as the Fibroblast Growth Factor (FGF) system. Besides their classical role as extracellular ligands, some FGFs exert also intracellular functions controlling neuronal differentiation. We have previously shown that intracellular FGF-2 binds to SMN and regulates the number of a subtype of nuclear bodies which are reduced in SMA patients. In the light of these findings, we systematically analyzed the FGF-system comprising five canonical receptors and 22 ligands in a severe mouse model of SMA. In this study, we demonstrate widespread alterations of the FGF-system in both muscle and spinal cord. Importantly, FGF-receptor 1 is upregulated in spinal cord at a pre-symptomatic stage as well as in a mouse motoneuron-like cell-line NSC34 based model of SMA. Consistent with that, phosphorylations of FGFR-downstream targets Akt and ERK are increased. Moreover, ERK hyper-phosphorylation is functionally linked to FGFR-1 as revealed by receptor inhibition experiments. Our study shows that the FGF system is dysregulated at an early stage in SMA and may contribute to the SMA pathogenesis.
Conflict of interest statement
Figures


Similar articles
-
Loganin possesses neuroprotective properties, restores SMN protein and activates protein synthesis positive regulator Akt/mTOR in experimental models of spinal muscular atrophy.Pharmacol Res. 2016 Sep;111:58-75. doi: 10.1016/j.phrs.2016.05.023. Epub 2016 May 27. Pharmacol Res. 2016. PMID: 27241020
-
Proteomic assessment of a cell model of spinal muscular atrophy.BMC Neurosci. 2011 Mar 8;12:25. doi: 10.1186/1471-2202-12-25. BMC Neurosci. 2011. PMID: 21385431 Free PMC article.
-
ERK and ROCK functionally interact in a signaling network that is compensationally upregulated in Spinal Muscular Atrophy.Neurobiol Dis. 2017 Dec;108:352-361. doi: 10.1016/j.nbd.2017.09.005. Epub 2017 Sep 12. Neurobiol Dis. 2017. PMID: 28916199
-
Therapeutic strategies for spinal muscular atrophy: SMN and beyond.Dis Model Mech. 2017 Aug 1;10(8):943-954. doi: 10.1242/dmm.030148. Dis Model Mech. 2017. PMID: 28768735 Free PMC article. Review.
-
The contribution of mouse models to understanding the pathogenesis of spinal muscular atrophy.Dis Model Mech. 2011 Jul;4(4):457-67. doi: 10.1242/dmm.007245. Dis Model Mech. 2011. PMID: 21708901 Free PMC article. Review.
Cited by
-
Modified Hyaluronic Acid-Laminin-Hydrogel as Luminal Filler for Clinically Approved Hollow Nerve Guides in a Rat Critical Defect Size Model.Int J Mol Sci. 2021 Jun 18;22(12):6554. doi: 10.3390/ijms22126554. Int J Mol Sci. 2021. PMID: 34207389 Free PMC article.
-
Impairment of the neurotrophic signaling hub B-Raf contributes to motoneuron degeneration in spinal muscular atrophy.Proc Natl Acad Sci U S A. 2021 May 4;118(18):e2007785118. doi: 10.1073/pnas.2007785118. Proc Natl Acad Sci U S A. 2021. PMID: 33931501 Free PMC article.
-
The Need for SMN-Independent Treatments of Spinal Muscular Atrophy (SMA) to Complement SMN-Enhancing Drugs.Front Neurol. 2020 Feb 3;11:45. doi: 10.3389/fneur.2020.00045. eCollection 2020. Front Neurol. 2020. PMID: 32117013 Free PMC article. Review.
-
Drug Discovery of Spinal Muscular Atrophy (SMA) from the Computational Perspective: A Comprehensive Review.Int J Mol Sci. 2021 Aug 20;22(16):8962. doi: 10.3390/ijms22168962. Int J Mol Sci. 2021. PMID: 34445667 Free PMC article. Review.
-
bootGSEA: a bootstrap and rank aggregation pipeline for multi-study and multi-omics enrichment analyses.Front Bioinform. 2024 Apr 3;4:1380928. doi: 10.3389/fbinf.2024.1380928. eCollection 2024. Front Bioinform. 2024. PMID: 38633435 Free PMC article.
References
-
- Lefebvre S, Burglen L, Reboullet S, Clermont O, Burlet P, et al. Identification and characterization of a spinal muscular atrophy-determining gene. Cell. 1995;80:155–165. - PubMed
-
- Lefebvre S, Burlet P, Liu Q, Bertrandy S, Clermont O, et al. Correlation between severity and SMN protein level in spinal muscular atrophy. Nat Genet. 1997;16:265–269. - PubMed
-
- Monani UR, Lorson CL, Parsons DW, Prior TW, Androphy EJ, et al. A single nucleotide difference that alters splicing patterns distinguishes the SMA gene SMN1 from the copy gene SMN2. Hum Mol Genet. 1999;8:1177–1183. - PubMed
-
- Taylor JE, Thomas NH, Lewis CM, Abbs SJ, Rodrigues NR, et al. Correlation of SMNt and SMNc gene copy number with age of onset and survival in spinal muscular atrophy. Eur J Hum Genet. 1998;6:467–474. - PubMed
Publication types
MeSH terms
Substances
LinkOut - more resources
Full Text Sources
Medical
Molecular Biology Databases
Miscellaneous

