. 2012;7(2):e31384.
doi: 10.1371/journal.pone.0031384. Epub 2012 Feb 14.

Losartan slows pancreatic tumor progression and extends survival of SPARC-null mice by abrogating aberrant TGFβ activation

Affiliations

Losartan slows pancreatic tumor progression and extends survival of SPARC-null mice by abrogating aberrant TGFβ activation

Shanna A Arnold et al. PLoS One. 2012.

Abstract

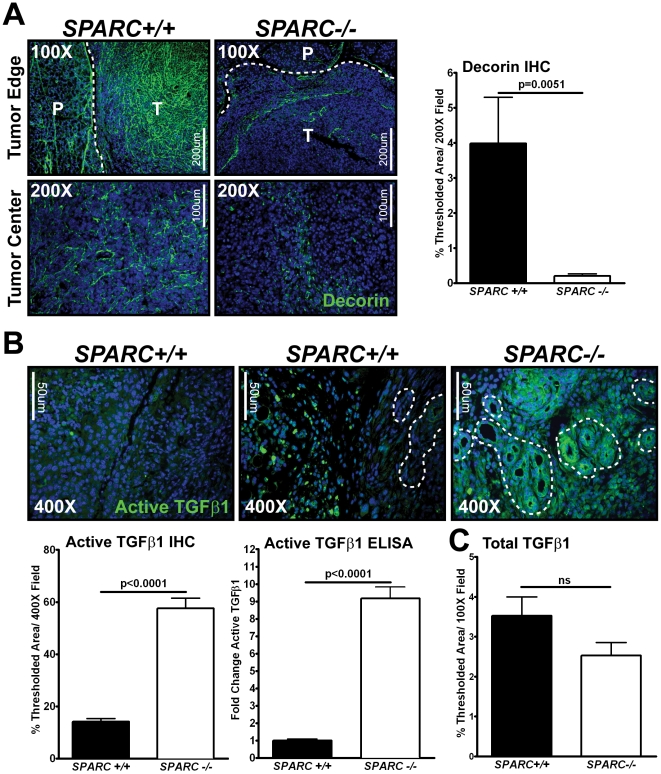
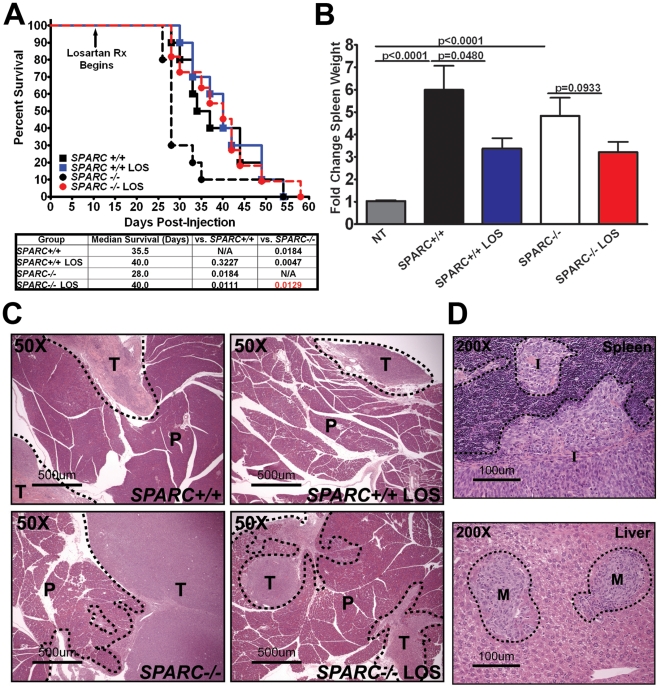
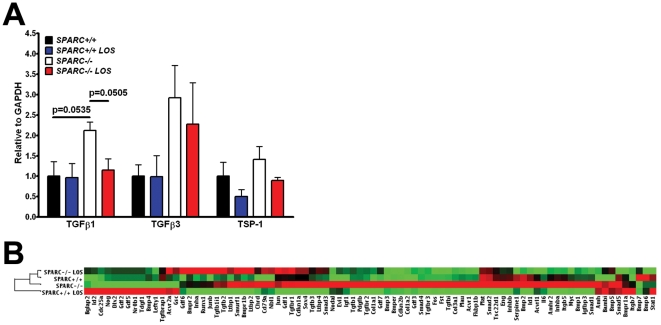
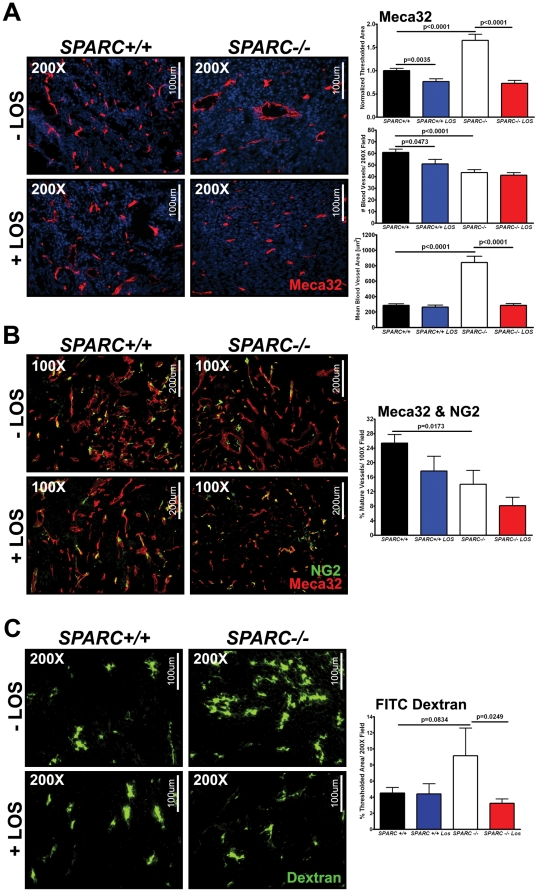
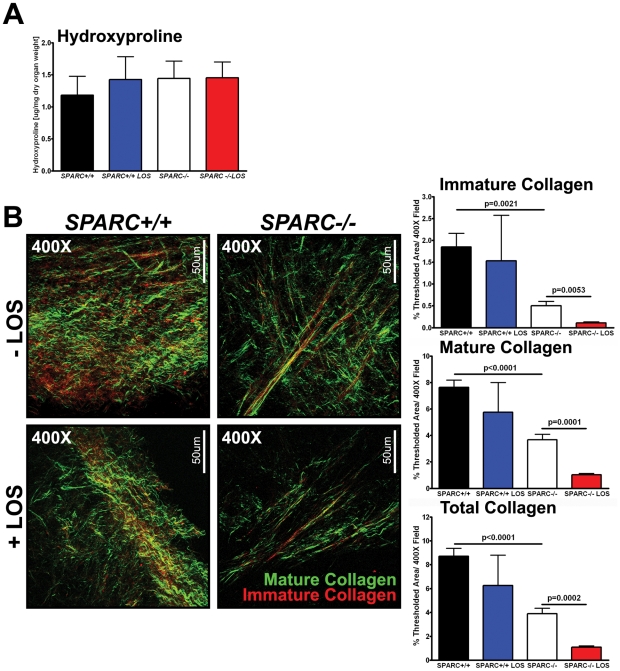
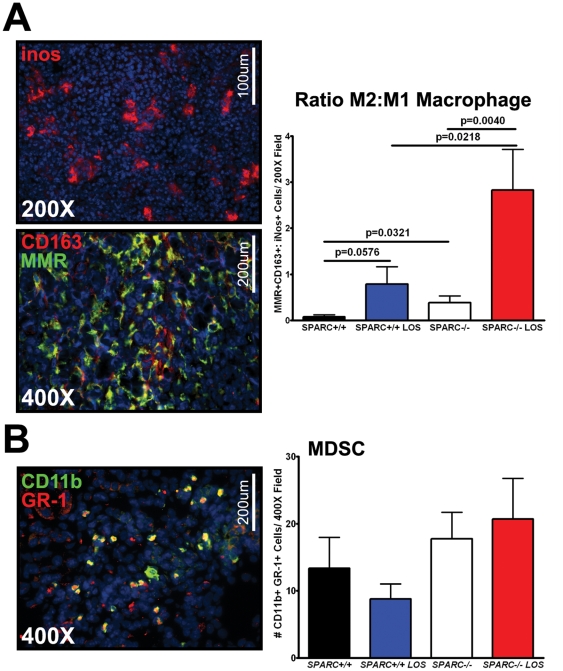
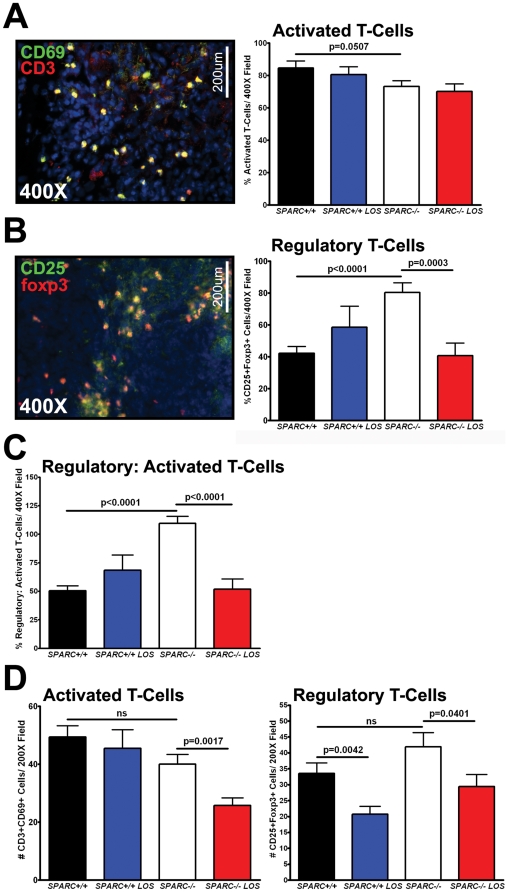
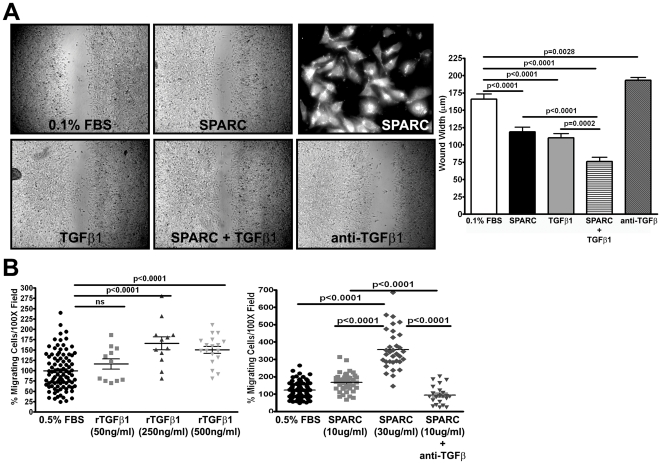
Pancreatic adenocarcinoma, a desmoplastic disease, is the fourth leading cause of cancer-related death in the Western world due, in large part, to locally invasive primary tumor growth and ensuing metastasis. SPARC is a matricellular protein that governs extracellular matrix (ECM) deposition and maturation during tissue remodeling, particularly, during wound healing and tumorigenesis. In the present study, we sought to determine the mechanism by which lack of host SPARC alters the tumor microenvironment and enhances invasion and metastasis of an orthotopic model of pancreatic cancer. We identified that levels of active TGFβ1 were increased significantly in tumors grown in SPARC-null mice. TGFβ1 contributes to many aspects of tumor development including metastasis, endothelial cell permeability, inflammation and fibrosis, all of which are altered in the absence of stromal-derived SPARC. Given these results, we performed a survival study to assess the contribution of increased TGFβ1 activity to tumor progression in SPARC-null mice using losartan, an angiotensin II type 1 receptor antagonist that diminishes TGFβ1 expression and activation in vivo. Tumors grown in SPARC-null mice progressed more quickly than those grown in wild-type littermates leading to a significant reduction in median survival. However, median survival of SPARC-null animals treated with losartan was extended to that of losartan-treated wild-type controls. In addition, losartan abrogated TGFβ induced gene expression, reduced local invasion and metastasis, decreased vascular permeability and altered the immune profile of tumors grown in SPARC-null mice. These data support the concept that aberrant TGFβ1-activation in the absence of host SPARC contributes significantly to tumor progression and suggests that SPARC, by controlling ECM deposition and maturation, can regulate TGFβ availability and activation.


Conflict of interest statement

Competing Interests: The authors have declared that no competing interests exist.

Figures

Figure 1
Figure 1. TGFβ1 and the TGFβ binding proteoglycan, decorin, are altered in tumors grown in the absence of stromal SPARC.
Fluorescence immunohistochemistry was utilized to quantify the amount of active and total TGFβ1, as well as decorin in tumors grown in SPARC+/+ and SPARC−/− mice (A–C). (A) Tumor sections were stained with antibody goat anti-decorin (green) and percent thresholded area quantified. DAPI (blue) marks cell nuclei. Images were taken at the tumor edge (top panels) and the tumor center (bottom panels). Total magnification is 100× (scale bar, 200 µM) and 200× (scale bar, 100 µM) as indicated. Dotted lines indicate the border between the tumor (T) and normal pancreas (P). (B) Tumor sections were stained with an antibody rabbit anti-TGFâ1 (green) specific for the active form and percent thresholded area quantified. DAPI (blue) marks cell nuclei. Total magnification is 400× (scale bar, 50 µM) as indicated. Dotted lines indicate spontaneous abnormal ducts arising from the Pan02 cells within the tumor. The amount of active TGFâ1 in tumor lysates was also measured using a commercial sandwich ELISA kit (G7591 Promega). Data represents two independent assays that are combined by normalizing all samples to SPARC+/+ and recorded as fold change. 50 µg of total protein was loaded per well and samples were run in either duplicate or quadruplicate. (C) Total TGFβ1 protein within tumors was assessed with antibody rabbit anti-TGFβ1,2,3 and percent thresholded area quantified. All p-values were calculated with a Student's t-test. ns, not significant.
Figure 2
Figure 2. Losartan improves survival of tumor-bearing SPARC−/− mice.
A–C) 1×10⁶ Pan02 cells were injected into the tail of the pancreas of SPARC+/+ and SPARC−/− mice. Tumors were allowed to grow for 10 days prior to initiation of losartan therapy (600 mg/L) via drinking water ad libitum in 2% sucrose. A) Survival curve of SPARC+/+ and SPARC−/− mice treated with losartan (LOS). The table lists the median survival and associated p-values calculated with the Gehan-Breslow-Wilcoxon test (n = 10/group). The survival curve is modified from Arnold et al 2010 . B) Graph displays spleen weight and the fold change calculated based on the weight of spleens taken from non-tumor bearing (NT) mice. Significance was determined by a Student's t-test and all significant p-values are indicated. C, D) 1×10⁶ Pan02 cells were injected into the tail of the pancreas of SPARC+/+ and SPARC−/− mice. Losartan therapy was given as above was initiated 24 hours after tumor cell injection and mice were sacrificed 28 days later. (C) Images of H&E stained primary tumor sections show residual pancreas and the primary tumor border of untreated and losartan-treated (LOS) SPARC+/+ and SPARC−/− mice. Dotted lines demarcate the normal adjacent pancreas (P) from the primary tumor (T). Total magnification (50×) and scale bars (500 µm) are indicated. (D) H&E section of a spleen displaying disruption of the splenic capsule and local tumor invasion (I). Total magnification (200×) and scale bars (100 µm) are shown. Image of an H&E stained liver section revealing the common site for distant metastasis (M). Total magnification (200×) and scale bars (100 µm) are indicated.
Figure 3
Figure 3. Losartan reduces TGFβ-induced gene expression in tumors from SPARC−/− mice.
(A) The mRNA expression of TGFβ1, TGFβ3 and TSP-1 in tumors from SPARC+/+ and SPARC−/− mice treated with losartan was assessed with taqman-based qPCR. n = 3/group and p-values were calculated with the Student's t-test. (B) Clustergram results from the RT2 Profiler™ PCR Array (PAMM-035; SABiosciences). Green indicates negative fold-regulation, whereas red indicates positive fold-regulation relative to six internal control genes.
Figure 4
Figure 4. Losartan decreases vessel size but not effect microvessel density or pericyte recruitment in Pan02 tumors grown in SPARC−/− animals.
Fluorescence immunohistochemistry was utilized to quantify microvessel density and pericyte recruitment in Pan02 orthotopic tumors grown in SPARC+/+ and SPARC−/− mice treated with losartan (A–B). (A) Tumor sections were stained with rat anti-mouse endothelial cell Meca-32 (red) . DAPI (blue) marks cell nuclei. The percent thresholded area normalized to untreated SPARC+/+, number of blood vessels and mean blood vessel area were quantified. Total magnification (200×) and scale bars (100 µm) are indicated. (B) Sections were stained with Meca-32 and rabbit anti-NG2. Percent mature vessels were calculated as the number of Meca-32 & NG2 colocalized vessels divided by the total number of Meca-32 positive vessels. Total magnification (100×) and scale bars (200 µm) are shown. C) SPARC+/+ and SPARC−/− mice bearing orthotopic Pan02 tumors and treated with losartan were injected intravenously with fluorescein isothiocyanate-conjugated dextran (FITC-Dextran) (25 mg/ml) (2×10⁶ mw; D7137; Molecular Probes/Invitrogen) in 0.9% sterile saline at a dose of 200 µl/mouse. The fluorescent dextran was allowed to circulate 10 minutes before the mice were euthanized. Tissue was snap-frozen, sectioned (10 µm) and immediately analyzed by fluorescence microscopy. Percent thresholded area was quantified. Total magnification (200×) and scale bars (100 µm) are indicated. All p-values were calculated with the Student's t test.
Figure 5
Figure 5. Losartan effect on collagen deposition and maturation.
The amount of collagen production, deposition and maturation was assessed in Pan02 orthotopic tumors grown in SPARC+/+ and SPARC−/− mice treated with losartan. (A) The amount of collagen produced and secreted within tumors was quantified by hydroxyproline analysis. (B) Collagen content and maturity was quantified by second harmonic generation (SHG). Frozen tumor sections (50 µm) were mounted in PBS. Collagen fibers within the tumor sections were excited at 900 nm to generate a SHG signal which was then detected at 450 nm. Both forward scattered signal, indicative of mature collagen (green) and backward scattered signal, indicative of immature collagen (red) was detected. Percent thresholded area of immature, mature and total collagen was quantified. Total magnification (400×) and scale bars (50 µm) are indicated. All p-values were calculated with the Student's t test.
Figure 6
Figure 6. Losartan does not decrease macrophage and MDSC infiltration.
Fluorescence immunohistochemistry was utilized to assess macrophage and myeloid derived suppressor cell (MDSC) recruitment in tumors grown in Pan02 orthotopic tumors grown in SPARC+/+ and SPARC−/− mice treated with losartan (A–B). (A) Frozen tumor sections were stained with either antibody rabbit anti inos (red) for detection of M1 macrophage or antibody rabbit anti CD163 (red) and antibody rat anti MMR (green) for detection of M2 macrophage. DAPI (blue) marks cell nuclei. The number of inos positive cells and the number of CD163 and MMR double positive cells was counted and the ratio of M2 to M1 calculated. Total magnification (200×, 400×) and scale bars (100 µm, 200 µm) are indicated. (B) Frozen tumor sections were stained with antibodies FITC-conjugated rat anti CD11b (green) and CY3-conjugated rat anti GR-1 (red). DAPI (blue) marks cell nuclei. The number of CD11b and GR-1 double positive cells was counted. Total magnification (400×) and scale bars (200 µm) are indicated. All p-values were calculated with the Student's t test.
Figure 7
Figure 7. Losartan reduces Treg levels in Pan02 tumors grown in SPARC−/− mice.
Fluorescence immunohistochemistry was utilized to assess the recruitment of activated and regulatory T-cells in Pan02 orthotopic tumors (A–C) or spleens (D) in SPARC+/+ and SPARC−/− mice treated with losartan. (A) Frozen tumor sections were stained with antibody rat anti-CD3 (red) and hamster anti-CD69 (green) for detection of activated T-cells. DAPI (blue) marks cell nuclei. Percent activated T-cells was calculated by dividing the number of CD3 and CD69 double positive cells by the total number of CD3 positive cells. Total magnification (400×) and scale bars (200 µm) are indicated. (B) Frozen tumor sections were stained with rat anti-foxp3 (red) and rat anti-CD25 (green) for detection of regulatory T-cells. DAPI (blue) marks cell nuclei. Percent regulatory T-cells was calculated by dividing the number of foxp3 and CD25 double positive cells by the total number of CD3 positive cells. Total magnification (400×) and scale bars (200 µm) are indicated. (C) The ratio of regulatory T-cells to activated T-cells was calculated by dividing the number of CD3 and CD69 double positive cells by the number of foxp3 and CD25 double positive cells. Data was recorded as percent. (D) Frozen splenic sections were stained for activated and regulatory T-cells as described in A and B. The number of activated and regulatory T-cells was counted. ns, not significant. All p-values were calculated with the Student's t test.
Figure 8
Figure 8. SPARC and TGFβ1 promote Pan02 migration.
The ability of SPARC and TGFβ1 to control Pan02 cell migration in vitro was assessed. (A) A wound-healing assay was utilized to determine if SPARC and TGFβ1 could act concomitantly to enhance Pan02 migration. Cells were plated at a density of 1.5×10⁵ cells per well in 96-well plates and allowed to grow to 100% confluency. A scratch was made and cells allowed to migrate into the wound. Recombinant SPARC (10 µg/ml), recombinant TGFβ1 (250 ng/ml) and anti-TGFβ1,2,3 (10 µg/ml) were prepared in DMEM 0.1% FBS. The wound width (µm) was measured after 6 hours. Inset of immunocytochemistry with antibody goat anti-mouse SPARC reveals that Pan02 cells do express SPARC. (B) A transwell migration assay was performed as an additional means to assess SPARC and TGFβ1 effect on Pan02 migration, as well as, to determine if SPARC effect on Pan02 migration is TGFβ dependent. Cells were serum-starved overnight then seeded at 20,000 cells per 24-well 0.8 µm cell culture insert (BD Falcon). DMEM 0.1% FBS served as the chemoattractant. Recombinant SPARC (10 and 30 µg/ml) was added to the upper chamber, while recombinant TGFβ1 (50, 250 and 500 ng/ml) and anti-TGFβ1,2,3 (5 µg/ml) were added to the bottom chamber. Cells were allowed to migrate 24 hours at 37°C in 5% CO2. Migrated cells were fixed, stained and counted. Cell counts were normalized to DMEM 0.1% FBS and recorded as % migrating cells. ns, not significant. All p-values were calculated with the Student's t test.

Similar articles

Cited by

References

    1. Ghaneh P, Costello E, Neoptolemos JP. Biology and management of pancreatic cancer. Gut. 2007;56:1134–1152. - PMC - PubMed
    1. Bornstein P. Cell-matrix interactions: the view from the outside. Methods Cell Biol. 2002;69:7–11. - PubMed
    1. Reed MJ, Puolakkainen P, Lane TF, Dickerson D, Bornstein P, et al. Differential expression of SPARC and thrombospondin 1 in wound repair: immunolocalization and in situ hybridization. J Histochem Cytochem. 1993;41:1467–1477. - PubMed
    1. Podhajcer OL, Benedetti LG, Girotti MR, Prada F, Salvatierra E, et al. The role of the matricellular protein SPARC in the dynamic interaction between the tumor and the host. Cancer Metastasis Rev. 2008;27:691–705. - PubMed
    1. Pen A, Moreno MJ, Martin J, Stanimirovic DB. Molecular markers of extracellular matrix remodeling in glioblastoma vessels: microarray study of laser-captured glioblastoma vessels. Glia. 2007;55:559–572. - PubMed

Publication types