

In vitro murine leukemia retroviral integration and structure fluctuation of target DNA
- PMID: 22348097
- PMCID: PMC3279379
- DOI: 10.1371/journal.pone.0031533
In vitro murine leukemia retroviral integration and structure fluctuation of target DNA
Abstract
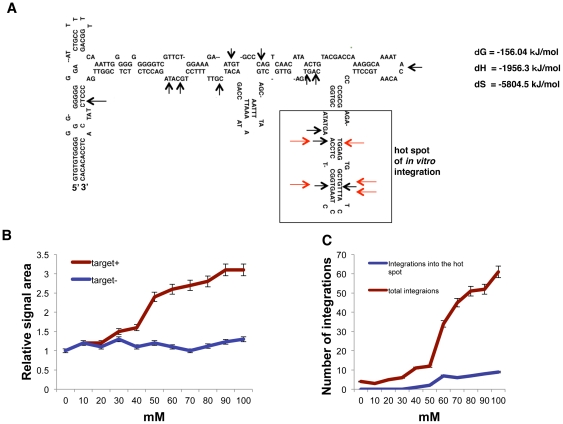
Integration of the retroviral genome into host DNA is a critical step in the life cycle of a retrovirus. Although assays for in vitro integration have been developed, the actual DNA sequences targeted by murine leukemia retrovirus (MLV) during in vitro reproduction are unknown. While previous studies used artificial target sequences, we developed an assay using target DNA sequences from common MLV integration sites in Stat5a and c-myc in the genome of murine lymphomas and successfully integrated MLV into the target DNA in vitro. We calculated the free energy change during folding of the target sequence DNA and found a close correlation between the calculated free energy change and the number of integrations. Indeed, the integrations closely correlated with fluctuation of the structure of the target DNA segment. These data suggest that the fluctuation may generate a DNA structure favorable for in vitro integration into the target DNA. The approach described here can provide data on the biochemical properties of the integration reaction to which the target DNA structure may contribute.
Conflict of interest statement
Figures


Similar articles
-
Hotspots of MLV integration in the hematopoietic tumor genome.Oncogene. 2017 Mar 2;36(9):1169-1175. doi: 10.1038/onc.2016.285. Epub 2016 Nov 7. Oncogene. 2017. PMID: 27721401 Free PMC article. Review.
-
Murine leukemia retrovirus integration induces the formation of transcription factor complexes on palindromic sequences in the signal transducer and activator of transcription factor 5a gene during the development of pre-B lymphomagenesis.Am J Pathol. 2011 Mar;178(3):1374-86. doi: 10.1016/j.ajpath.2010.12.012. Am J Pathol. 2011. PMID: 21356387 Free PMC article.
-
Weak palindromic consensus sequences are a common feature found at the integration target sites of many retroviruses.J Virol. 2005 Apr;79(8):5211-4. doi: 10.1128/JVI.79.8.5211-5214.2005. J Virol. 2005. PMID: 15795304 Free PMC article.
-
Retroviral integration: structure of the initial covalent product and its precursor, and a role for the viral IN protein.Proc Natl Acad Sci U S A. 1989 Apr;86(8):2525-9. doi: 10.1073/pnas.86.8.2525. Proc Natl Acad Sci U S A. 1989. PMID: 2539592 Free PMC article.
-
Integration target site selection for retroviruses and transposable elements.Cell Mol Life Sci. 2004 Oct;61(19-20):2588-96. doi: 10.1007/s00018-004-4206-9. Cell Mol Life Sci. 2004. PMID: 15526164 Free PMC article. Review.
Cited by
-
In vitro HIV-1 LTR integration into T-cell activation gene CD27 segment and the decoy effect of modified-sequence DNA.PLoS One. 2012;7(11):e49960. doi: 10.1371/journal.pone.0049960. Epub 2012 Nov 28. PLoS One. 2012. PMID: 23209625 Free PMC article.
-
Hotspots of MLV integration in the hematopoietic tumor genome.Oncogene. 2017 Mar 2;36(9):1169-1175. doi: 10.1038/onc.2016.285. Epub 2016 Nov 7. Oncogene. 2017. PMID: 27721401 Free PMC article. Review.
-
Intact Viral Particle Counts Measured by Flow Virometry Provide Insight into the Infectivity and Genome Packaging Efficiency of Moloney Murine Leukemia Virus.J Virol. 2020 Jan 6;94(2):e01600-19. doi: 10.1128/JVI.01600-19. Print 2020 Jan 6. J Virol. 2020. PMID: 31694951 Free PMC article.
References
-
- Yamanaka S, Takahashi K. Induction of pluripotent stem cells from mouse embryonic and adult fibroblast cultures by defined factors. Cell. 2006;126:663–676. - PubMed
-
- Hacein-Bey-Abina S, Von Kalle C, Schmidt M, McCcormack MP, Wulffraat N, et al. LMO2-associated clonal T cell proliferation in two patients after gene therapy for SCID-X1. Science. 2003;302:415–419. - PubMed
-
- Wu XL, Li Y, Crise B, Burgess SM. Transcription start regions in the human genome are favored targets for MLV integration. Science. 2003;300:1749–1751. - PubMed
-
- Tsukahara T, Agawa H, Matsumoto S, Matsuda M, Ueno S, et al. Murine leukemia virus vector integration favors promoter regions and regional hot spots in a human T-cell line. Biochem Biophys Res Commun. 2006;345:1099–1107. - PubMed
Publication types
MeSH terms
Substances
LinkOut - more resources
Full Text Sources
Molecular Biology Databases
Research Materials
Miscellaneous
