Elements in the canine distemper virus M 3' UTR contribute to control of replication efficiency and virulence
- PMID: 22348107
- PMCID: PMC3278443
- DOI: 10.1371/journal.pone.0031561
Elements in the canine distemper virus M 3' UTR contribute to control of replication efficiency and virulence
Abstract
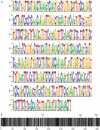
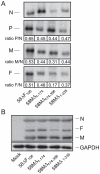
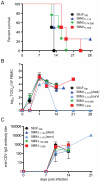
Canine distemper virus (CDV) is a negative-sense, single-stranded RNA virus within the genus Morbillivirus and the family Paramyxoviridae. The Morbillivirus genome is composed of six transcriptional units that are separated by untranslated regions (UTRs), which are relatively uniform in length, with the exception of the UTR between the matrix (M) and fusion (F) genes. This UTR is at least three times longer and in the case of CDV also highly variable. Exchange of the M-F region between different CDV strains did not affect virulence or disease phenotype, demonstrating that this region is functionally interchangeable. Viruses carrying the deletions in the M 3' UTR replicated more efficiently, which correlated with a reduction of virulence, suggesting that overall length as well as specific sequence motifs distributed throughout the region contribute to virulence.
Conflict of interest statement
Figures


Similar articles
-
Region between the canine distemper virus M and F genes modulates virulence by controlling fusion protein expression.J Virol. 2008 Nov;82(21):10510-8. doi: 10.1128/JVI.01419-08. Epub 2008 Aug 27. J Virol. 2008. PMID: 18753197 Free PMC article.
-
Biological properties of phocine distemper virus and canine distemper virus.APMIS Suppl. 1993;36:1-51. APMIS Suppl. 1993. PMID: 8268007 Review.
-
Investigation of a unique short open reading frame within the 3' untranslated region of the canine distemper virus matrix messenger RNA.Virus Res. 2010 Nov;153(2):234-43. doi: 10.1016/j.virusres.2010.08.007. Epub 2010 Aug 24. Virus Res. 2010. PMID: 20797417
-
Influence of vaccine strains on the evolution of canine distemper virus.Infect Genet Evol. 2016 Jul;41:262-269. doi: 10.1016/j.meegid.2016.04.014. Epub 2016 Apr 18. Infect Genet Evol. 2016. PMID: 27101783
-
Tropism and molecular pathogenesis of canine distemper virus.Virol J. 2019 Mar 7;16(1):30. doi: 10.1186/s12985-019-1136-6. Virol J. 2019. PMID: 30845967 Free PMC article. Review.
Cited by
-
Peste des petits ruminants virus non-structural C protein inhibits the induction of interferon-β by potentially interacting with MAVS and RIG-I.Virus Genes. 2021 Feb;57(1):60-71. doi: 10.1007/s11262-020-01811-y. Epub 2021 Jan 3. Virus Genes. 2021. PMID: 33389635 Free PMC article.
-
Analysis of the highly diverse gene borders in Ebola virus reveals a distinct mechanism of transcriptional regulation.J Virol. 2014 Nov;88(21):12558-71. doi: 10.1128/JVI.01863-14. Epub 2014 Aug 20. J Virol. 2014. PMID: 25142600 Free PMC article.
-
Organization, Function, and Therapeutic Targeting of the Morbillivirus RNA-Dependent RNA Polymerase Complex.Viruses. 2016 Sep 10;8(9):251. doi: 10.3390/v8090251. Viruses. 2016. PMID: 27626440 Free PMC article. Review.
-
The Nature of Exposure Drives Transmission of Nipah Viruses from Malaysia and Bangladesh in Ferrets.PLoS Negl Trop Dis. 2016 Jun 24;10(6):e0004775. doi: 10.1371/journal.pntd.0004775. eCollection 2016 Jun. PLoS Negl Trop Dis. 2016. PMID: 27341030 Free PMC article.
-
Wild-type measles viruses with non-standard genome lengths.PLoS One. 2014 Apr 18;9(4):e95470. doi: 10.1371/journal.pone.0095470. eCollection 2014. PLoS One. 2014. PMID: 24748123 Free PMC article.
References
-
- Sidhu MS, Chan J, Kaelin K, Spielhofer P, Radecke F, et al. Rescue of synthetic measles virus minireplicons: measles genomic termini direct efficient expression and propagation of a reporter gene. Virology. 1995;208:800–807. - PubMed
-
- Lamb RA, Parks GD. Paramyxoviridae: The Viruses and Their Replication. In: Knipe DM, Howley PM, Griffin DE, Lamb RA, Martin MA, et al., editors. Fields Virology. 5th ed. Philadelphia, PA: Lippincott Williams & Wilkins; 2007. pp. 1449–1496.
-
- Heider A, Santibanez S, Tischer A, Gerike E, Tikhonova N, et al. Comparative investigation of the long non-coding M-F genome region of wild-type and vaccine measles viruses. Arch Virol. 1997;142:2521–2528. - PubMed
Publication types
MeSH terms
Substances
Grants and funding
LinkOut - more resources
Full Text Sources

