. 2012;7(2):e31708.
doi: 10.1371/journal.pone.0031708. Epub 2012 Feb 13.

Quercetin-4'-O-β-D-glucopyranoside (QODG) inhibits angiogenesis by suppressing VEGFR2-mediated signaling in zebrafish and endothelial cells

Affiliations

Quercetin-4'-O-β-D-glucopyranoside (QODG) inhibits angiogenesis by suppressing VEGFR2-mediated signaling in zebrafish and endothelial cells

Chen Lin et al. PLoS One. 2012.

Abstract

Background: Angiogenesis plays an important role in many physiological and pathological processes. Identification of small molecules that block angiogenesis and are safe and affordable has been a challenge in drug development. Hypericum attenuatum Choisy is a Chinese herb medicine commonly used for treating hemorrhagic diseases. The present study investigates the anti-angiogenic effects of quercetin-4'-O-β-D-glucopyranoside (QODG), a flavonoid isolated from Hypericum attenuatum Choisy, in vivo and in vitro, and clarifies the underlying mechanism of the activity.

Methodology/principal findings: Tg(fli1:EGFP) transgenic zebrafish embryos were treated with different concentrations of quercetin-4'-O-β-D-glucopyranoside (QODG) (20, 60, 180 µM) from 6 hours post fertilisation (hpf) to 72 hpf, and adult zebrafish were allowed to recover in different concentrations of QODG (20, 60, 180 µM) for 7 days post amputation (dpa) prior morphological observation and angiogenesis phenotypes assessment. Human umbilical vein endothelial cells (HUVECs) were treated with or without VEGF and different concentrations of QODG (5, 20, 60, 180 µM), then tested for cell viability, cell migration, tube formation and apoptosis. The role of VEGFR2-mediated signaling pathway in QODG-inhibited angiogenesis was evaluated using quantitative real-time PCR (qRT-PCR) and Western blotting.

Conclusion/significance: Quercetin-4'-O-β-D-glucopyranoside (QODG) was shown to inhibit angiogenesis in human umbilical vein endothelial cells (HUVECs) in vitro and zebrafish in vivo via suppressing VEGF-induced phosphorylation of VEGFR2. Our results further indicate that QODG inhibits angiogenesis via inhibition of VEGFR2-mediated signaling with the involvement of some key kinases such as c-Src, FAK, ERK, AKT, mTOR and S6K and induction of apoptosis. Together, this study reveals, for the first time, that QODG acts as a potent VEGFR2 kinase inhibitor, and exerts the anti-angiogenic activity at least in part through VEGFR2-mediated signaling pathway.


Conflict of interest statement

Competing Interests: The authors have declared that no competing interests exist.

Figures

Figure 1
Figure 1. Chemical structure of quercetin-4′-O-β-D-glucopyranoside (QODG).
Quercetin-4′-O-β-D-glucopyranoside (QODG) has a molecular formula C21H20O12 with a molecular weight of 464.3763 g/mol.
Figure 2
Figure 2. Toxic effects of QODG on zebrafish.
Tg(fli1:EGFP) zebrafish embryos were treated with various concentrations of QODG (100, 200, 300, 400, 500, 600, 700, 800, 900, 1000 µM) from 6 hours post fertilization (hpf) to 72 hpf. During the period, the fish were observed for survival and morphology under an inverted microscope (at both 10×magnification and 100×magnification). Data were analyzed by statistical package SPSS 17.0 for non-linear regression from three independent experiments, and LC0 (i.e., LCmin) was defined as the minimum lethal concentration that resulted in 0% mortality of zebrafish treated with QODG.
Figure 3
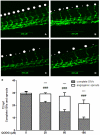
Figure 3. QODG inhibits blood vessel formation in ISVs of zebrafish embryos.
(A) Vehicle control: Tg(fli1:EGFP) zebrafish embryos were treated with 0.1% DMSO from 6 hours post fertilization (hpf) to 72 hpf. All intersegmental vessels (ISVs) in the vehicle control group have fully extended to form the dorsal longitudinal anastomotic vessels (DLAVs) at 72 hpf. (B–D) QODG-treated groups: Tg(fli1:EGFP) zebrafish embryos were treated with various concentrations of QODG (20, 60, 180 µM) from 6 hpf to 72 hpf. Pentagons indicate the sites of complete ISVs in zebrafish embryos for all figures, and asterisks indicate the sites of angiogenic sprouts in zebrafish embryos for all figures. (E) Quantitative comparison of blood vessel formation in the vehicle control group and QODG-treated groups. Data are expressed as mean ± SD from three independent experiments. *, the number of complete ISVs in QODG-treated group compared with that in the vehicle control group; ***, P<0.001 vs. vehicle control. #, the number of angiogenic sprouts in QODG-treated group compared with that in the vehicle control group; ###, P<0.001 vs. vehicle control. Scale bars, 200 µm.
Figure 4
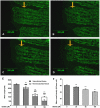
Figure 4. QODG inhibits angiogenesis in regenerative caudal fin of zebrafish at 7 days post amputation.
(A) Vehicle control: Tg(fli1:EGFP) zebrafish caudal fins were clipped at the mid-fin level, then the fish were allowed to recover in 0.1% DMSO for 7 days post amputation (dpa). (B–D) QODG-treated groups: Tg(fli1:EGFP) zebrafish were allowed to recover in various concentrations of QODG (20, 60, 180 µM) for 7 dpa. Orange arrow indicates the amputation site in caudal fin of adult zebrafish for all figures. (E) Quantitative comparison of the lengths of regenerative vessel and fin in the vehicle control group and QODG-treated groups. Data are expressed as mean ± SD from three independent experiments. *, the length of regenerative vascularized fin tissue in QODG-treated group compared with that in the vehicle control group; ***, P<0.001 vs. vehicle control. #, the length of regenerative nonvascularized fin tissue in QODG-treated group compared with that in the vehicle control group; ###, P<0.001 vs. vehicle control. (F) Quantitative comparison of the vessel densities of regenerative caudal fin in the vehicle control group and QODG-treated groups. Data are expressed as mean ± SD from three independent experiments. *, the vessel density of regenerative caudal fin in QODG-treated group compared with that in the vehicle control group; ***, P<0.001 vs. vehicle control. Scale bars, 200 µm.
Figure 5
Figure 5. QODG inhibits cell viability in endothelial cells.
(A) QODG inhibited cell viability in a dose-dependent manner under normal culture condition. HUVECs were cultured in ECGM containing 20% FBS, then cells (2×10⁴ cells/well) were treated with DMSO (0.1%) or various concentrations of QODG (5, 20, 60, 180 µM) for 24 h. Cell viability was quantified by MTS assay. Cells receiving only DMSO (0.1%) served as a vehicle control. Data are expressed as percentages of the vehicle control (100%) in mean ± SD from three independent experiments in triplicates. **, P<0.01 vs. vehicle control; ***, P<0.001 vs. vehicle control. (B) QODG inhibited cell viability in a dose-dependent manner under VEGF-induced condition. HUVECs (2×10⁴ cells/well) were starved with ECGM supplemented with 0.5% FBS for 24 h, and then treated with or without VEGF (10 ng/mL) and DMSO (0.1%) or various concentrations of QODG (5, 20, 60, 180 µM) for another 24 h. Cell viability was quantified by MTS assay. Cells receiving only DMSO (0.1%) served as a vehicle control. Data are expressed as percentages of the vehicle control (100%) in mean ± SD from three independent experiments in triplicates. **, P<0.01 vs. VEGF-treated control; ***, P<0.001 vs. VEGF-treated control.
Figure 6
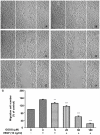
Figure 6. QODG inhibits VEGF–induced chemotactic motility of endothelial cells.
QODG inhibited the migration of HUVECs. HUVECs were allowed to grow to full confluence in 6-well plates pre-coated with 0.1% gelatin and then starved with ECGM containing 0.5% FBS to inactivate cell proliferation. After that, cells were wounded with pipette and washed with PBS, then treated with or without VEGF (10 ng/mL) and DMSO (0.1%) or different concentrations of QODG (5, 20, 60, 180 µM) in ECGM containing 0.5% FBS. Images were taken using an inverted microscope (Olympus, Center Valley, PA, USA) (at 100×magnification) after 8 h of incubation, and migrated cells were quantified by manual counting. (A) Migration assay of HUVECs treated with only DMSO (0.1%). (B) Migration assay of HUVECs treated with VEGF (10 ng/mL) and DMSO (0.1%). (C–F) Migration assay of HUVECs treated with VEGF (10 ng/mL) and various concentrations of QODG (5, 20, 60, 180 µM). (G) Quantitative comparison of the numbers of migrated cells in different groups. Cells receiving only DMSO (0.1%) served as a vehicle control. Data are expressed as percentages of the vehicle control (100%) in mean ± SD from three independent experiments. **, P<0.01 vs. VEGF-treated control; ***, P<0.001 vs. VEGF-treated control. Scale bars, 100 µm.
Figure 7
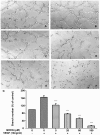
Figure 7. QODG inhibits VEGF-induced capillary structure formation of endothelial cells on Matrigel.
QODG inhibited VEGF-induced tube formation of HUVECs. HUVECs were starved with ECGM containing 0.5% FBS, and then treated with DMSO (0.1%) or various concentrations of QODG (5, 20, 60, 180 µM). After that, cells were collected and placed in 24-well plates coated with Matrigel (4×10⁴ cells/well), followed by the activation of VEGF (10 ng/mL). After 6 h of incubation, images of the network-like structures of endothelial cells were taken using an inverted microscope (Olympus, Center Valley, PA, USA) (at 100×magnification), and branching points in different groups were quantified by manual counting. (A) HUVECs cultured on Matrigel were treated with only DMSO (0.1%). (B) HUVECs cultured on Matrigel were treated with VEGF (10 ng/mL) and DMSO (0.1%). (C–F) HUVECs cultured on Matrigel were treated with VEGF (10 ng/mL) and various concentrations of QODG (5, 20, 60, 180 µM). (G) Quantitative comparison of the numbers of branching points in different groups. Cells receiving only DMSO (0.1%) served as a vehicle control. Data are expressed as percentages of the vehicle control (100%) in mean ± SD from three independent experiments. ***, P<0.001 vs. VEGF-treated control. Scale bars, 100 µm.
Figure 8
Figure 8. QODG insignificantly regulates the VEGF-triggered activation of VEGFR1 and VEGFR2 mRNAs expression in HUVECs.
HUVECs (5×10⁵ cells/well) were treated with or without VEGF (50 ng/mL) and DMSO (0.1%) or various concentrations of QODG (20, 60, 180 µM) for 24 h. RNA was extracted with TRIzol® Reagent (Invitrogen, Life Technologies, Grand Island, NY, USA), reverse transcribed with PrimeScript™ RT reagent kit (TaKaRa, Otsu, Shiga, Japan), and quantitated by qRT-PCR using SYBR® Premix Ex Taq™ (TaKaRa, Otsu, Shiga, Japan). Cells receiving only DMSO (0.1%) served as a vehicle control. The levels of VEGFR1 and VEGFR2 mRNAs are normalized by β-actin and expressed as percentages of the vehicle control (100%) in mean ± SD from three independent experiments in triplicates. P>0.05 vs. VEGF-treated control.
Figure 9
Figure 9. QODG inhibits VEGF-induced phosphorylation of VEGFR2 kinase and VEGFR2-mediated signaling pathway downstream molecules in HUVECs.
(A) QODG inhibited VEGF-induced phosphorylation of VEGFR2 in a dose-dependent manner, but phospho-VEGFR1 protein, the total amount of VEGFR1 and VEGFR2 proteins in each sample of cells all remained comparable. After probed with the antibodies anti-VEGFR2, anti-VEGFR1, anti-phospho-VEGFR2 and anti-phospho-VEGFR1, total VEGFR2 and VEGFR1 proteins, and phospho-VEGFR2 and VEGFR1 proteins in different groups were examined by Western blotting analysis. Three independent experiments were performed in triplicates. (B) QODG inhibited VEGFR2 kinase activity. Inhibition of VEGFR2 kinase activity by QODG was analyzed using an in vitro HTScan® VEGF receptor 2 kinase kit (Cell Signaling Technology, Danvers, MA, USA) combined with colorimetric ELISA detection according to the manufacturer's instructions. The reaction processed with only DMSO (0.1%) served as a vehicle control. Data are expressed as percentages of the vehicle control. Three independent experiments were performed. (C, D) QODG inhibited the activation of VEGFR2-mediated downstream signaling. The activation of c-Src, FAK and ERK (C), AKT, mTOR and p70S6K (D) was suppressed by QODG. After probed with specific antibodies, proteins in different groups were examined by Western blotting analysis. Three independent experiments were performed in triplicates.
Figure 10
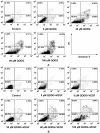
Figure 10. QODG induces apoptosis in HUVECs as evidenced by annexin V/PI double staining and FACS analysis.
Effects of QODG on endothelial cell death were measured by annexin V-FITC/PI flow cytometry. HUVECs (2×10⁶ cells/mL) were treated with or without VEGF (10 ng/mL) and DMSO (0.1%) or various concentrations of QODG (5, 20, 60, 180 µM) for 24 h, followed by labeling for phosphatidylserine externalization with annexin V-FITC and cell membrane integrity with PI. (A) QODG induced apoptosis in HUVECs treated without VEGF in a dose-dependent manner. (B) QODG induced apoptosis in HUVECs treated with VEGF in a dose-dependent manner. The lower right quadrant (annexin-V+/PI−) represents early apoptosis, while the upper right quadrant (annexin V+/PI+) represents late apoptosis and necrosis. Data are representatives of three independent experiments with similar results.
Figure 11
Figure 11. QODG potentiates apoptosis in HUVECs in a dose-dependent manner.
(A–B) Relative percentages of early apoptotic cells (annexin-V+/PI−) and necrotic or late apoptotic cells (annexin-V+/PI+) were analyzed with one-way ANOVA followed by Tukey's multiple comparison test. Cells receiving only DMSO (0.1%) served as a vehicle control. Data are expressed as percentages of the vehicle control (100%) in mean ± SD from three independent experiments. (A) The percentages of early apoptotic cells and necrotic or late apoptotic cells increased in a dose-dependent manner when HUVECs were treated without VEGF. #, the percentage of early apoptotic cells (annexin-V+/PI−) in QODG-treated group compared with that in the vehicle control group; ##, P<0.01 vs. vehicle control; ###, P<0.001 vs. vehicle control. *, the percentage of late apoptotic cells (annexin-V+/PI+) in QODG-treated group compared with that in the vehicle control group; ***, P<0.001 vs. vehicle control. (B) The percentages of early apoptotic cells and necrotic or late apoptotic cells increased in a dose-dependent manner when HUVECs were treated with VEGF. #, the percentage of early apoptotic cells (annexin-V+/PI−) in QODG-treated group compared with that in the VEGF-treated control group; ##, P<0.01 vs. VEGF-treated control; ###, P<0.001 vs. VEGF-treated control. *, the percentage of late apoptotic cells (annexin-V+/PI+) in QODG-treated group compared with that in the VEGF-treated control group; *, P<0.05 vs. VEGF-treated control; ***, P<0.001 vs. VEGF-treated control. (C–D) QODG induced caspase-3 activation and the cleavage of PARP from its intact form to its cleaved form. Proteins from HUVECs treated with or without VEGF (10 ng/mL) and DMSO (0.1%) or various concentrations of QODG (5, 20, 60, 180 µM) were analyzed by Western blotting analysis for cleaved caspase-3 and cleaved PARP.
Figure 12
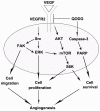
Figure 12. The anti-angiogenic signaling pathways regulated by QODG in HUVECs.
Proposed mechanism for inhibition of angiogenesis by QODG. Arrows indicate regulations by QODG treatment in experimental results.

Similar articles

Cited by

References

    1. Quesada AR, Muñoz-Chápuli R, Medina MA. Anti-angiogenic drugs: from bench to clinical trials. Med Res Rev. 2006;26:483–530. - PubMed
    1. Carmeliet P. Angiogenesis in life, disease and medicine. Nature. 2005;438:932–936. - PubMed
    1. Folkman J. What is the evidence that tumors are angiogenesis dependent? J Natl Cancer Inst. 1990;82:4–6. - PubMed
    1. Eberhard A, Kahlert S, Goede V, Hemmerlein B, Plate KH, et al. Heterogeneity of angiogenesis and blood vessel maturation in human tumors: implications for anti-angiogenic tumor therapies. Cancer Res. 2000;60:1388–1393. - PubMed
    1. Compagni A, Christofori G. Recent advances in research on multistage tumorigenesis. Br J Cancer. 2000;83:1–5. - PMC - PubMed

Publication types

MeSH terms

LinkOut - more resources