

Universality of thermodynamic constants governing biological growth rates
- PMID: 22348140
- PMCID: PMC3279425
- DOI: 10.1371/journal.pone.0032003
Universality of thermodynamic constants governing biological growth rates
Abstract
Background: Mathematical models exist that quantify the effect of temperature on poikilotherm growth rate. One family of such models assumes a single rate-limiting 'master reaction' using terms describing the temperature-dependent denaturation of the reaction's enzyme. We consider whether such a model can describe growth in each domain of life.
Methodology/principal findings: A new model based on this assumption and using a hierarchical Bayesian approach fits simultaneously 95 data sets for temperature-related growth rates of diverse microorganisms from all three domains of life, Bacteria, Archaea and Eukarya. Remarkably, the model produces credible estimates of fundamental thermodynamic parameters describing protein thermal stability predicted over 20 years ago.
Conclusions/significance: The analysis lends support to the concept of universal thermodynamic limits to microbial growth rate dictated by protein thermal stability that in turn govern biological rates. This suggests that the thermal stability of proteins is a unifying property in the evolution and adaptation of life on earth. The fundamental nature of this conclusion has importance for many fields of study including microbiology, protein chemistry, thermal biology, and ecological theory including, for example, the influence of the vast microbial biomass and activity in the biosphere that is poorly described in current climate models.
Conflict of interest statement
Figures

 ,
,  ,
,  ,
,  , and
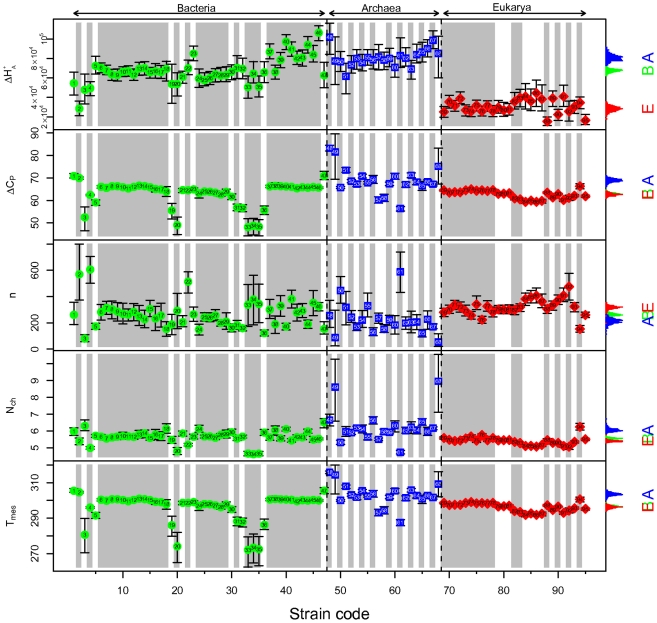
, and  . Bacterial strains are shown as circles, archaeal strains as squares, and eukaryote strains as diamonds. Posterior domain distributions are shown on the right margin. For both symbols and marginal distributions domains are colored green for Bacteria, blue for Archaea, and red for Eukarya. The strains are arranged so that those belonging to the same species are grouped contiguously. We show this by vertical gray and white shading that indicate when the strain species change; for example, strains 6—18 are all E. coli.

References
-
- Johnson FH, Lewin I. The growth rate of E. coli in relation to temperature, quinine and coenzyme. J Cell Physiol. 1946;28:47–75. - PubMed
-
- Murphy KP, Privalov PL, Gill SJ. Common features of protein unfolding and dissolution of hydrophobic compounds. Science. 1990;247:557–561. - PubMed
-
- Ratkowsky DA, Olley J, Ross T. Unifying temperature effects on the growth rate of bacteria and the stability of globular proteins. J Theor Biol. 2005;233:351–362. - PubMed
-
- Graziano G, Catanzano F, Barone G. Prediction of the heat capacity change on thermal denaturation of globular proteins. Thermochim Acta. 1998;321:23–31.
MeSH terms
LinkOut - more resources
Full Text Sources
