. 2012;7(2):e32029.
doi: 10.1371/journal.pone.0032029. Epub 2012 Feb 10.

Neurodevelopmental consequences of sub-clinical carbon monoxide exposure in newborn mice

Affiliations

Neurodevelopmental consequences of sub-clinical carbon monoxide exposure in newborn mice

Ying Cheng et al. PLoS One. 2012.

Abstract

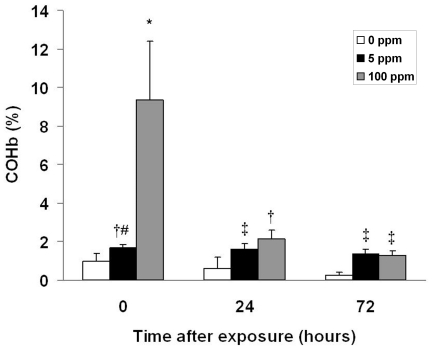
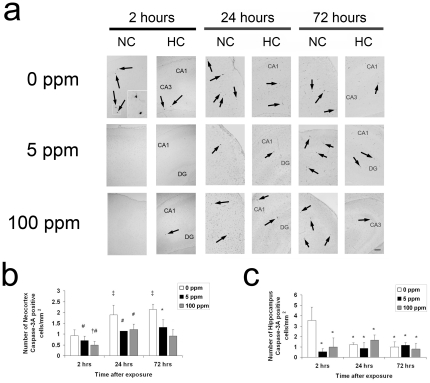
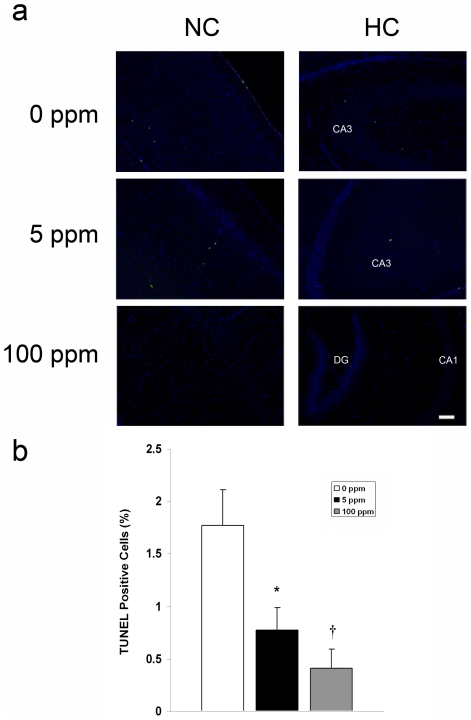
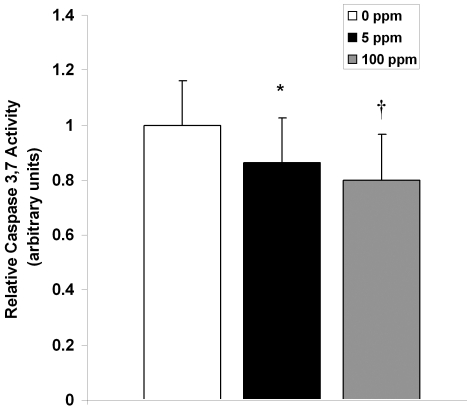
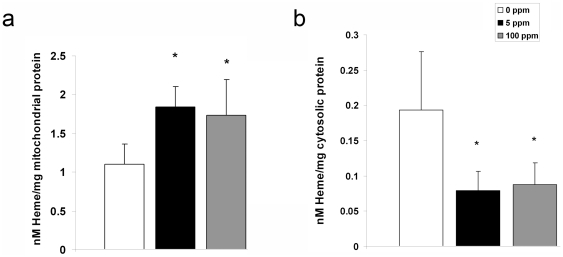
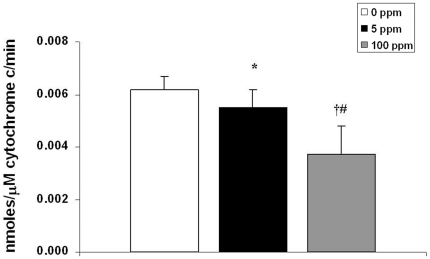
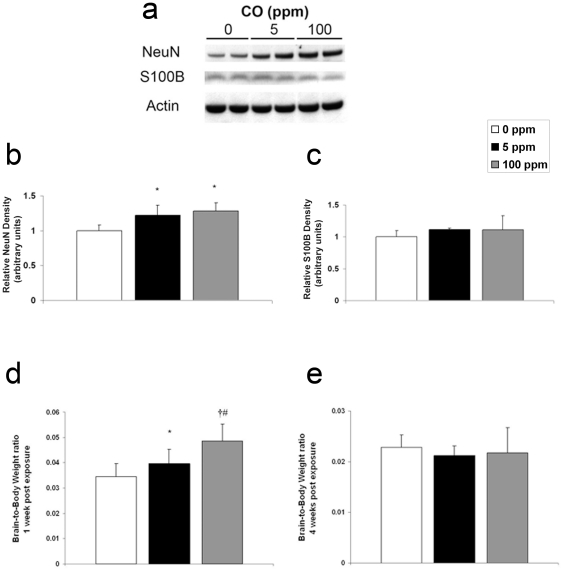
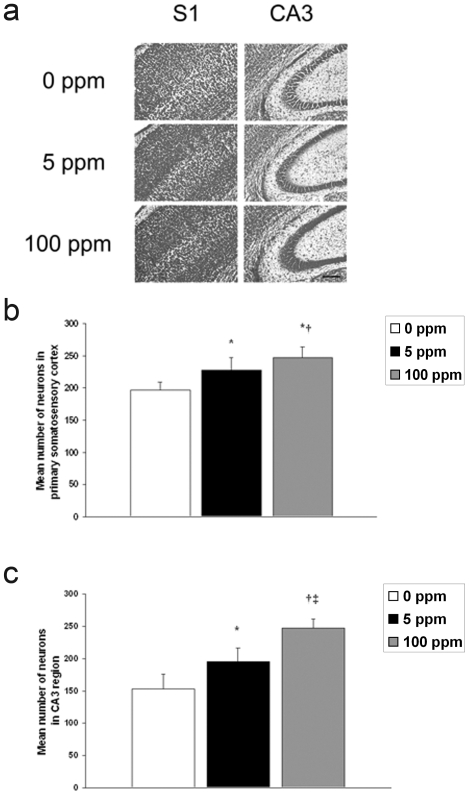
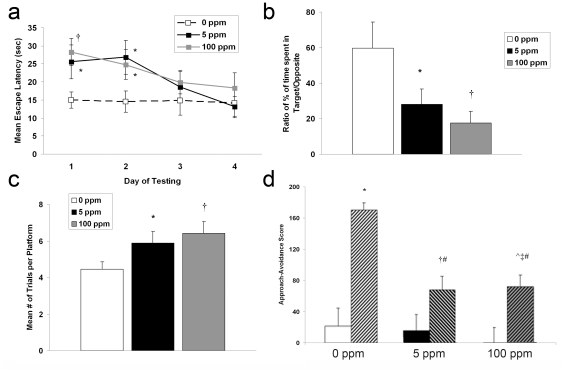
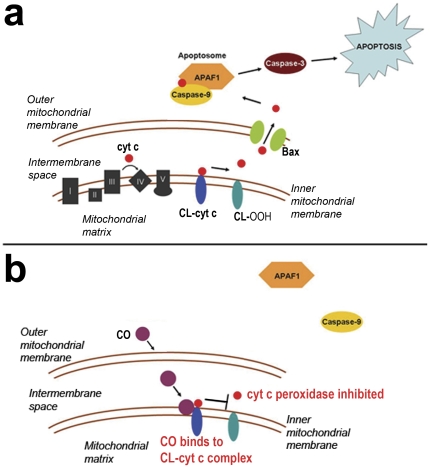
Carbon monoxide (CO) exposure at high concentrations results in overt neurotoxicity. Exposure to low CO concentrations occurs commonly yet is usually sub-clinical. Infants are uniquely vulnerable to a variety of toxins, however, the effects of postnatal sub-clinical CO exposure on the developing brain are unknown. Apoptosis occurs normally within the brain during development and is critical for synaptogenesis. Here we demonstrate that brief, postnatal sub-clinical CO exposure inhibits developmental neuroapoptosis resulting in impaired learning, memory, and social behavior. Three hour exposure to 5 ppm or 100 ppm CO impaired cytochrome c release, caspase-3 activation, and apoptosis in neocortex and hippocampus of 10 day old CD-1 mice. CO increased NeuN protein, neuronal numbers, and resulted in megalencephaly. CO-exposed mice demonstrated impaired memory and learning and reduced socialization following exposure. Thus, CO-mediated inhibition of neuroapoptosis might represent an important etiology of acquired neurocognitive impairment and behavioral disorders in children.


Conflict of interest statement

Competing Interests: The authors have declared that no competing interests exist.

Figures

Figure 1
Figure 1. Carboxyhemoglobin (COHb) levels following CO exposure.
COHb levels were measured immediately following 3-hour exposure (0 hours after exposure), 24 hours post exposure, and 72 hours post exposure in separate cohorts. Values are expressed as percentage (%) COHb means plus standard deviation. N = 8 animals per cohort. *P<.001 vs. all cohorts. P<.05 vs. all 0 ppm cohorts. P<.05 vs. 0 ppm 24, 72 hrs. # P<.05 vs. 100 ppm 72 hrs.
Figure 2
Figure 2. Activated caspase-3 decreases following CO exposure.
Immunohistochemistry for activated caspase-3 was performed on coronal sections 2 hours (hrs), 24 hrs, and 72 hrs post exposure. (a) Representative sections imaged at 10× from somatosensory neocortex (NC) and hippocampus (HC) obtained at the 2-hour time point, 24 and 72 hours following 3-hour exposure to air (0 ppm CO), 5 ppm CO, or 100 ppm CO are depicted. Activated caspase-3 positive neurons undergoing degeneration within the boxed in region in layer IV of the somatosensory neocortex are magnified in the inset of the 0 ppm CO section 2 hours post exposure. Black arrows indicate activated caspase-3 stained cells. CA1, CA3, dentate gyrus (DG) regions of HC are labeled. Scale bars, 100 µm. Quantification of activated caspase-3 stained cells in (b) neocortex and (c) hippocampus are demonstrated. Values are expressed as means plus standard deviation. (b) *P<.05 vs. 0 ppm 72 hrs. P<.05 vs. 0 ppm 2 hrs. # P<.05 vs. 0 ppm 24, 72 hrs. P<.05 vs. 5 ppm 24, 72 hrs. (c) *P<.02 vs. 0 ppm 2 hrs. N = 3–4 animals per cohort.
Figure 3
Figure 3. Neuroapoptosis decreases following CO exposure.
TUNEL assays were performed on coronal sections 2 hours post exposure. (a) Representative sections imaged at 10× from somatosensory neocortex (NC) and hippocampus (HC) 2 hours following 3-hour exposure to air (0 ppm CO), 5 ppm CO, or 100 ppm CO are depicted. Green TUNEL positive nuclei are visible. CA1, CA3, dentate gyrus (DG) regions of HC are labeled. Scale bars, 100 µm. (b) Quantification of total TUNEL positive nuclei from NC and HC in 3–4 non-serial coronal sections is demonstrated. Values are expressed as means plus standard deviation. N = 3–4 animals per cohort. *P<.02 vs. 0 ppm. P<.01 vs. 0 ppm.
Figure 4
Figure 4. Caspase-3 activity decreases following CO exposure.
Relative brain caspase-3,7 activity was measured in brain 2 hours post exposure. Values are expressed as means plus standard deviation. N = 10 animals per cohort. *P<.04 vs. 0 ppm. P<.01 vs. 0 ppm.
Figure 5
Figure 5. Cytochrome c release is impaired following CO exposure.
Heme c content within (a) mitochondria and (b) cytosol is demonstrated. Values are expressed as means plus standard deviation. *P<.05 vs. 0 ppm. N = 8 animals per cohort.
Figure 6
Figure 6. Cytochrome c peroxidase is inhibited following CO exposure.
Steady-state cytochrome c peroxidase activity immediately following 3-hour exposure is shown. Values are expressed as means plus standard deviation. N = 5 animals per cohort. *P<.05 vs. 0 ppm. P<.01 vs. 0 ppm. # P<.05 vs. 5 ppm.
Figure 7
Figure 7. Neuron specific antigen and relative brain size increase following CO exposure.
Cohorts were evaluated one week following 3-hour exposure to air (0 ppm CO), 5 ppm CO, or 100 ppm CO. (a) A representative immunoblot of neuron specific antigen (NeuN) and is depicted. CO exposed cohorts are demonstrated (0 ppm, 5 ppm, and 100 ppm). Actin was used as a loading control. Graphical representations of (b) NeuN and (c) S100β relative densities are shown. Air exposed values were arbitrarily set to 1. N = 5. Brain-to-body weight ratios (d) one week post exposure (N = 8 animals per cohort) and (e) four weeks post exposure (N = 10 animals per cohort) are demonstrated. Values are expressed as means plus standard deviation. *P<.05 vs. 0 ppm. P<.001 vs. 0 ppm. # P<.01 vs. 5 ppm.
Figure 8
Figure 8. Number of neurons in neocortex and hippocampus increase following CO exposure.
(a) Cresyl violet staining of coronal sections one week following 3-hour exposure to air (0 ppm CO), 5 ppm CO, or 100 ppm CO are demonstrated. S1 is primary somatosensory cortex; CA3 is CA3 region of hippocampus. Scale bar, 200 µm. (b) Quantification of the number of neurons in primary somatosensory cortex. Values are expressed as means plus standard deviation. *P<.001 vs. 0 ppm. †P<.03 vs. 5 ppm. (c) Quantification of the number of neurons in CA3 region of hippocampus. *P<.001 vs. 0 ppm. †P<.00001 vs. 0 ppm. ‡ P<.001 vs. 5 ppm. N = 3 animals per cohort.
Figure 9
Figure 9. Memory, learning, and social behavior are impaired following CO exposure.
(a–c) Morris water maze results are shown. (a) Escape latency time (in seconds) is demonstrated for the four days of reference memory testing. Values are expressed as means plus standard deviation. N = 13 animals per cohort. F value = 3.08. *P<.03 vs. 0 ppm. †P<.01 vs. 0 ppm. (b) Probe test is expressed as the ratio of percent time spent in the target quadrant versus the opposite quadrant. F value = 2.66. (c) Spatial working memory is expressed as the mean number of trials required to reach the hidden platform. Values are expressed as means plus standard deviation. N = 13 animals per cohort. F value = 2.73. *P<.05 vs. 0 ppm. †P<.01 vs. 0 ppm. (d) Social approach-avoidance scores for the CO-exposed cohorts are shown. Solid colored bars represent scores in absence of stimulus mouse (phase 1). Hashed bars represent scores in presence of stimulus mouse (phase 2). Values are expressed as means plus standard deviation. N = 13 animals per cohort. F value = 3.15. *P<.001 vs. 0 ppm phase 1. †P<.05 vs. 5 ppm phase 1. ‡P<.02 vs. 100 ppm phase 1. ∧ P<.05 vs. 5 ppm phase 1. #P<.001 vs. 0 ppm phase 2.
Figure 10
Figure 10. Mechanism of CO-mediated inhibition of apoptosis.
(a) The intrinsic pathway of apoptosis is depicted. Cytochrome c (cyt c), the mobile electron carrier between Complexes III and IV in the electron transport chain, is bound to cardiolipin (CL) on the inner mitochondrial membrane via both electrostatic and hydrophobic interactions. Cyt c has peroxidase activity and, in the presence of hydrogen peroxide, oxidizes CL to hydroperoxycardiolipin (CL-OOH). This mobilizes cyt c from the inner membrane and permits cyt c release following permeabilization of the outer membrane. (b) Mechanism of carbon monoxide (CO) inhibition of cyt c peroxidase is shown. CO diffuses across the outer mitochondrial membrane, binds to the cyt c-CL complex, and inhibits the cyt c peroxidase activity. This prevents oxidation of CL, mobilization of cyt c, cyt c release, and subsequent caspase activation.

Similar articles

Cited by

References

    1. Kao LW, Nañagas KA. Carbon monoxide poisoning. Emerg Med Clin North Am. 2004;22:985–1018. - PubMed
    1. Smithline HA, Ward KR, Chiulli DA, Blake HC, Rivers EP. Whole body oxygen consumption and critical oxygen delivery in response to prolonged and severe carbon monoxide poisoning. Resuscitation. 2003;56:97–104. - PubMed
    1. Hauck H, Neuberger M. Carbon monoxide uptake and the resulting carboxyhemoglobin in man. Eur J Appl Physiol Occup Physiol. 1984;53:186–90. - PubMed
    1. Gorman D, Drewry A, Huang YL, Sames C. The clinical toxicology of carbon monoxide. Toxicology. 2003;187:25–38. - PubMed
    1. Kao LW, Nanagas KA. Carbon monoxide poisoning. Med Clin North Am. 2005;89:1161–1194. - PubMed

Publication types

Substances