. 2012;6(2):e1470.
doi: 10.1371/journal.pntd.0001470. Epub 2012 Feb 14.

Climate-based models for understanding and forecasting dengue epidemics

Affiliations

Climate-based models for understanding and forecasting dengue epidemics

Elodie Descloux et al. PLoS Negl Trop Dis. 2012.

Abstract

Background: Dengue dynamics are driven by complex interactions between human-hosts, mosquito-vectors and viruses that are influenced by environmental and climatic factors. The objectives of this study were to analyze and model the relationships between climate, Aedes aegypti vectors and dengue outbreaks in Noumea (New Caledonia), and to provide an early warning system.

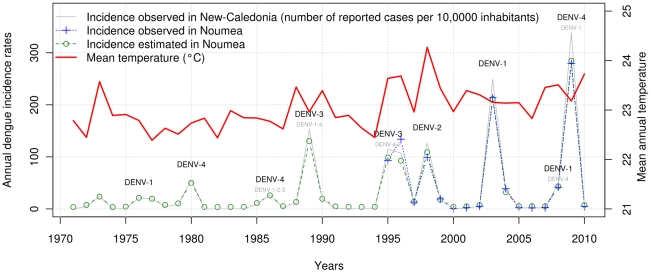
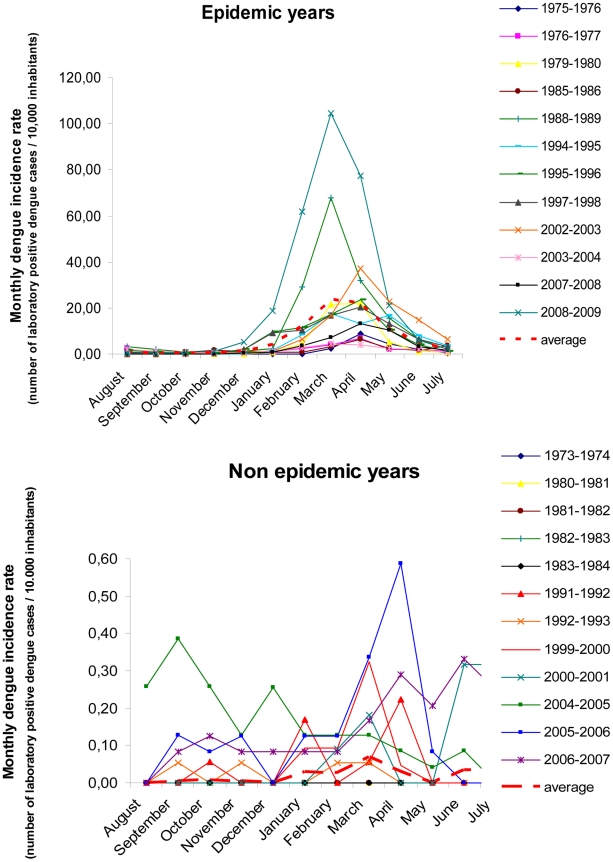
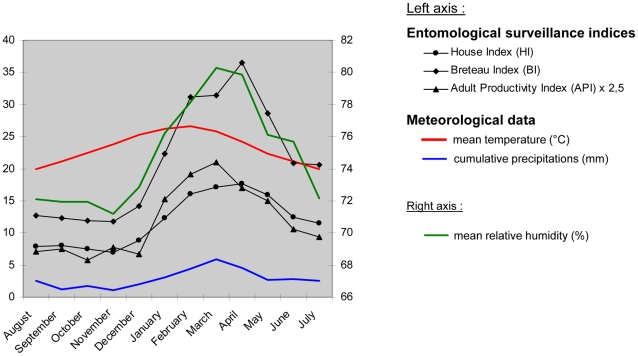
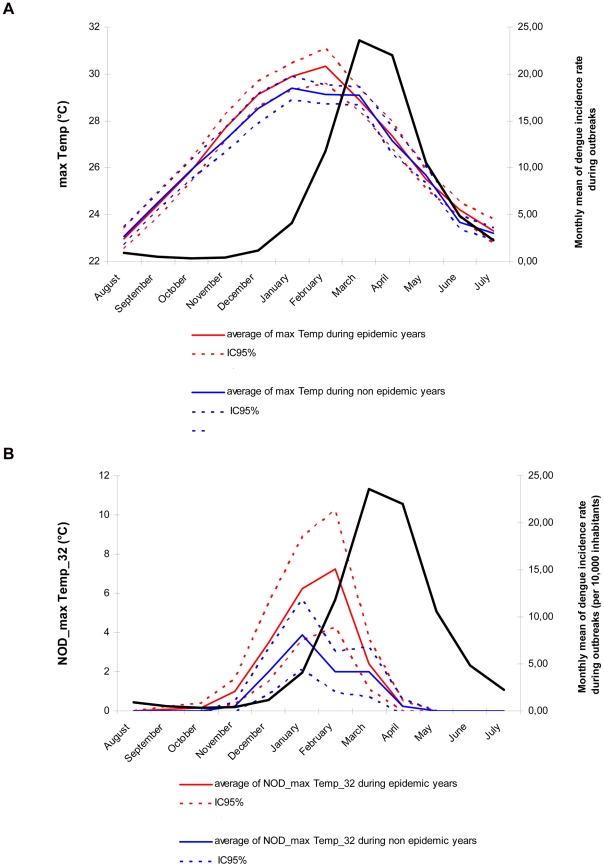
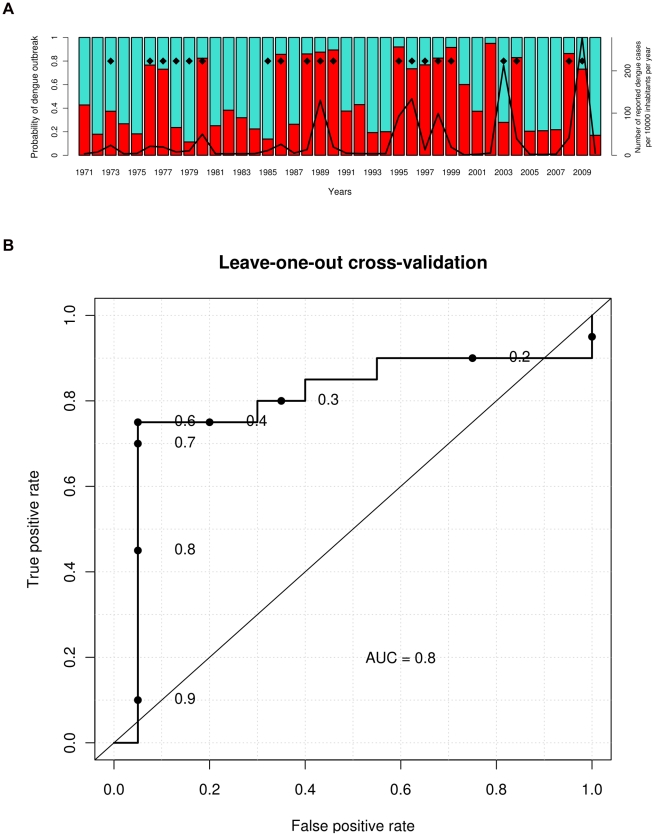
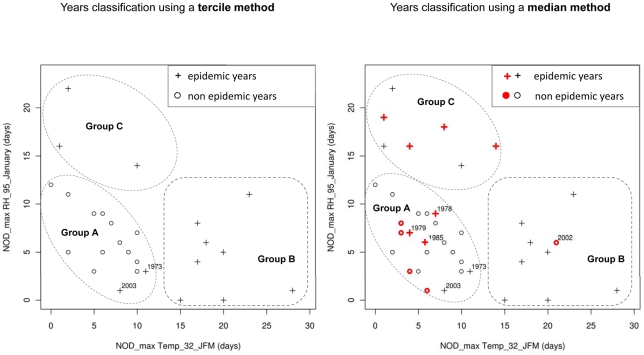
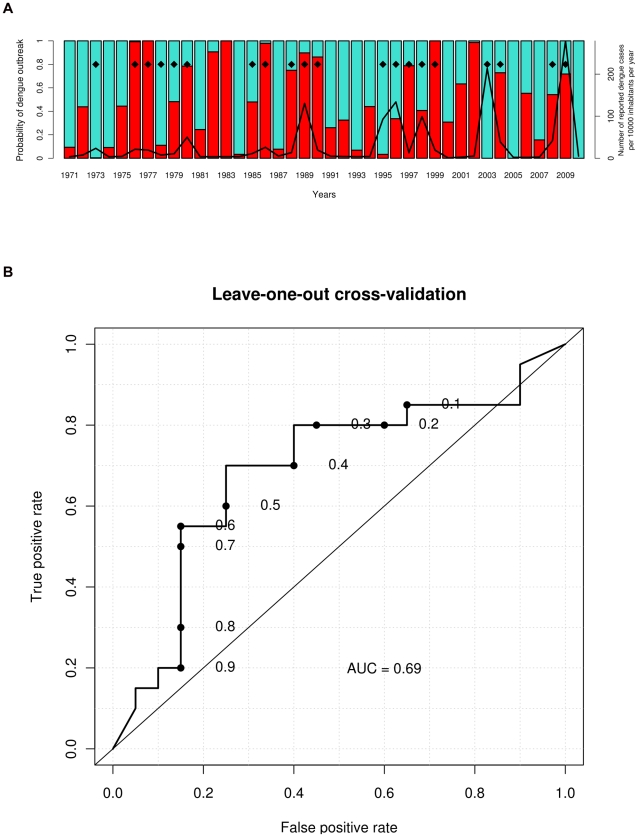
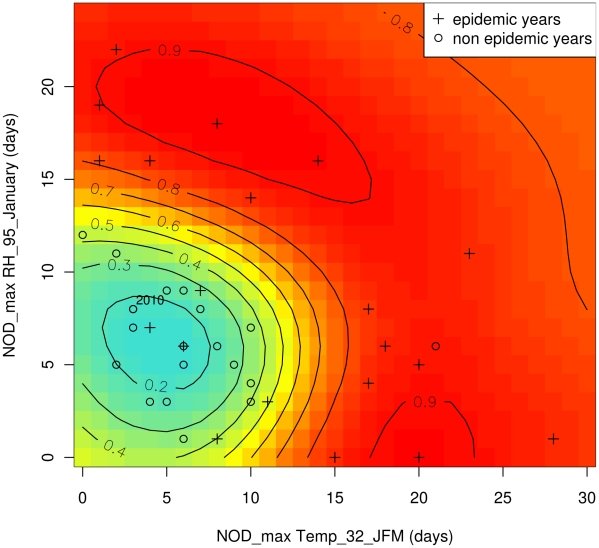
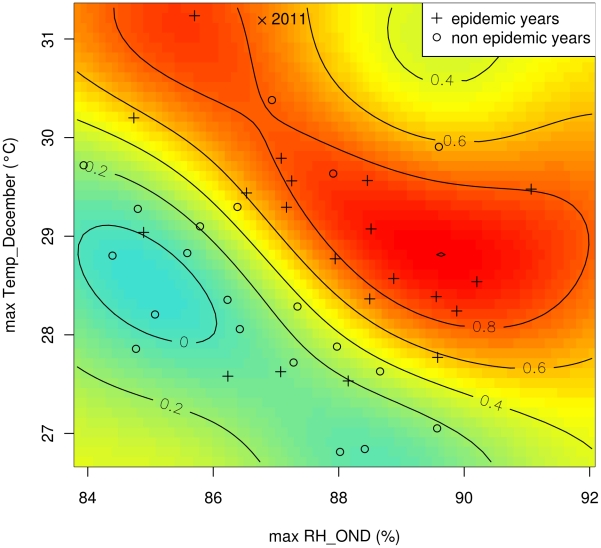
Methodology/principal findings: Epidemiological and meteorological data were analyzed from 1971 to 2010 in Noumea. Entomological surveillance indices were available from March 2000 to December 2009. During epidemic years, the distribution of dengue cases was highly seasonal. The epidemic peak (March-April) lagged the warmest temperature by 1-2 months and was in phase with maximum precipitations, relative humidity and entomological indices. Significant inter-annual correlations were observed between the risk of outbreak and summertime temperature, precipitations or relative humidity but not ENSO. Climate-based multivariate non-linear models were developed to estimate the yearly risk of dengue outbreak in Noumea. The best explicative meteorological variables were the number of days with maximal temperature exceeding 32°C during January-February-March and the number of days with maximal relative humidity exceeding 95% during January. The best predictive variables were the maximal temperature in December and maximal relative humidity during October-November-December of the previous year. For a probability of dengue outbreak above 65% in leave-one-out cross validation, the explicative model predicted 94% of the epidemic years and 79% of the non epidemic years, and the predictive model 79% and 65%, respectively.

Conclusions/significance: The epidemic dynamics of dengue in Noumea were essentially driven by climate during the last forty years. Specific conditions based on maximal temperature and relative humidity thresholds were determinant in outbreaks occurrence. Their persistence was also crucial. An operational model that will enable health authorities to anticipate the outbreak risk was successfully developed. Similar models may be developed to improve dengue management in other countries.


Conflict of interest statement

The authors have declared that no competing interests exist.

Figures

Figure 1
Figure 1. Epidemiology of dengue fever and evolution of annual mean temperature in Noumea-New Caledonia (1971–2010).
The predominant circulating serotype (DENV-1, DENV-2, DENV-3 or DENV-4) is indicated in black characters. When other serotypes were detected, they are indicated in little grey characters. Annual dengue incidence rates observed in Noumea over the 1995–2010 period are highly correlated with dengue incidence rates observed in New Caledonia (Spearman coefficient rho = 0.99, p-value = 1*10−14). Annual dengue incidence rates in Noumea (1971–1994) were estimated (green dotted line with circles) on the basis of the relationship between incidence rates observed in New Caledonia (grey line) and those observed in Noumea (blue dotted line with crosses) using a linear model. During the 1971–2010 period, dengue incidence rates and annual mean temperatures (from January to December) were significantly correlated in Noumea (Spearman's coefficient rho = 0.426, p-value = 0.007). An increasing trend of dengue outbreaks amplitude and annual mean temperatures were observed during this 40-year study period.
Figure 2
Figure 2. Monthly distribution of laboratory positive dengue cases during epidemic and non epidemic years.
A strong seasonality in the dengue cases distribution was observed during epidemic years with outbreaks occurring usually between January and July. By contrast, dengue cases occurred almost every month without a clear seasonal pattern during non epidemic years.
Figure 3
Figure 3. Seasonal evolution of monthly entomological surveillance indices and meteorological data in Noumea (August 2000–July 2009).
HI, BI and API evolution display a strong seasonal cycle, with highest values between January and July. Entomological surveillance indices were significantly correlated with meteorological data at the seasonal scale. The peak of mean Temp preceded the peak of Precip, mean RH and API with a lag of one month, and the peak of HI and BI with a lag of two months.
Figure 4
Figure 4. Relationship between maximal temperatures and dengue outbreaks in Noumea.
Averages and 95% confidence intervals (IC95%) of max Temp (Figure 4a) and NOD_max Temp_32 (Figure 4b) calculated monthly during epidemic and non epidemic years were compared from August (year y-1) to July (year y). The peak of max Temp preceded the epidemic peak of dengue with a lag of 1–2 months. The number of days with max Temp exceeding 32°C during the first quarter of the year was significantly higher during epidemic years than during non epidemic years, especially in February (NOD_max Temp_32_February = 7.25 versus 2 days, respectively).
Figure 5
Figure 5. SVM explicative model of dengue outbreaks in Noumea (leave-one-out cross validation).
The model estimates the probability of dengue outbreak occurrence (red bars) each year according to the number of days with maximal temperature exceeding 32°C during the first quarter of the year (NOD_max Temp_32_JFM), and the number of days with maximal relative humidity exceeding 95% during January (NOD_max RH_95_January). Results obtained in leave-one-out cross validation are presented in Figure 5a. The black line indicates the annual dengue incidence rate, and black diamonds indicate epidemic years according to the median method. The ROC curve (Figure 5b) indicates the rates of true and false positives for different detection thresholds. For example, for a probability of dengue outbreak above 65% (0.65), 15 of 20 epidemic years are predicted correctly (true positive rate = 75%) with only one false alarm (false positive rate = 5%). The sensitivity of the model for this threshold is 75% (15 epidemic years predicted correctly/20 epidemic years), the specificity 95% (19 non epidemic years predicted correctly/20 non epidemic years), the positive predictive value 94% (15 epidemic years predicted correctly/16 epidemic years predicted by the model), and the negative predictive value 79% (19 non epidemic years predicted correctly/24 non epidemic years predicted by the model).
Figure 6
Figure 6. Scatter plots of epidemic and non epidemic years with regards to NOD_max Temp_32_JFM and NOD_max RH_95_January.
Each year, the number of days with maximal temperature exceeding 32°C during January–February–March (NOD_max Temp_32_JFM) and the number of days with maximal relative humidity exceeding 95% during January (NOD_max RH_95_January) were calculated. Two methods denoted “tercile method” and “median method” were used to separate the years on the basis of annual dengue incidence rates in Noumea (see Methods). On the left panel, epidemic years (dengue incidence rate in the upper tercile, i.e. >19.48 cases/10,000 inhabitants/year) and non epidemic years (dengue incidence rate in the lower tercile, i.e. <4.13 cases/10,000 inhabitants/year) are presented. The distribution of crosses (epidemic years) and circles (non epidemic years) permits the identification of three groups (A, B, C). All non epidemic years belonged to group A whereas all epidemic years, except 1973 and 2003, belonged to either group B or group C suggesting that dengue outbreaks can occur in distinct climatic conditions. On the right panel, epidemic years (dengue incidence rate greater than the median, i.e. 7.65 cases/10,000 inhabitants/year) and non epidemic years (dengue incidence rate lower than the median) are presented with the advantage of a whole set of data being usable for modelling. Years that were not considered with the tercile method (dengue incidence rate in the middle tercile) are coloured in red. Further epidemic (red crosses) and non epidemic years (red circles) are considered with the median method, and similar groups (A, B, C) were identified. With the median method, three epidemic years (1978, 1979 and 1985) and one non epidemic year (2002) were incorrectly classified. These four years were characterized by annual dengue incidence rates closed to the median.
Figure 7
Figure 7. SVM predictive model of dengue outbreaks in Noumea (leave-one-out cross validation).
The model estimates the probability of dengue outbreak occurrence (red bars) each year y according to the quarterly mean of maximal relative humidity during October–November–December (max RH_OND), and the monthly mean of maximal temperature in December (max Temp_December) year y-1. Results obtained in leave-one-out cross validation are presented in Figure 7a. The black line indicates the annual dengue incidence rate, and black diamonds indicate epidemic years according to the median method. The ROC curve (Figure 7b) indicates the rates of true and false positives for different detection thresholds. For example, for a probability of dengue outbreak above 65% (0.65), 11 of 20 epidemic years were predicted correctly (true positive rate = 55%) with three false alarms (false positive rate = 15%). The sensitivity of this model for this threshold is 55% (11 epidemic years predicted correctly/10 epidemic years), the specificity 85% (17 non epidemic years predicted correctly/20 non epidemic years), the positive predictive value 79% (11 epidemic years predicted correctly/14 epidemic years predicted by the model), and the negative predictive value 65% (17 non epidemic years predicted correctly/26 non epidemic years predicted by the model).
Figure 8
Figure 8. SVM explicative model probability contours superimposed with NOD_max Temp_32_JFM and NOD_max RH_95_January during epidemic/non epidemic years.
Line-curves indicate the estimated probability of dengue outbreak occurrence given by the model. Blue colour indicates low risk, yellow colour indicates intermediate risk, and red colour indicates high risk of dengue outbreak. Meteorological parameters used to build the SVM models are shown for epidemic years (crosses) and non epidemic years (circles). The number of days with maximal temperature exceeding 32°C during January–February–March (NOD_max Temp_32_JFM) and the number of days with maximal relative humidity >95% during January (NOD_max RH_95_January) of the year y were used to build the SVM explicative model.
Figure 9
Figure 9. SVM predictive model probability contours superimposed with max RH_OND and max Temp_December during epidemic/non epidemic years.
Similarly to the SVM explicative model (Figure 8), the quarterly mean of maximal relative humidity during October–November–December (max RH_OND), and the monthly mean maximal temperature in December (max Temp_December) of the year y-1 were used to build the SVM predictive model.

Similar articles

Cited by

References

    1. WHO Dengue guidelines for diagnosis, treatment, prevention and control. 2009. Available: http://whqlibdoc.who.int/publications/2009/9789241547871_eng.pdf. Accessed 10 December 2010. - PubMed
    1. Gubler DJ. Dengue and Dengue Hemorrhagic Fever. Clin Microbiol Rev. 1998;11:480–496. - PMC - PubMed
    1. Rigau-Pérez JG, Clark GG, Gubler DJ, Reiter P, Sanders EJ, et al. Dengue and dengue haemorrhagic fever fever. Lancet. 1998;352:971–977. - PubMed
    1. Gubler DJ. Epidemic dengue/dengue hemorrhagic fever as a public health, social and economical problem in the 21th century. Trends Microbiol. 2002;10:100–103. - PubMed
    1. Hales S, de Wet N, Maindonald J, Woodward A. Potential effect of population and climate changes on global distribution of dengue fever: an empirical model. Lancet. 2002;360:830–834. - PubMed

Publication types