

CD161 DEFINES EFFECTOR T CELLS THAT EXPRESS LIGHT AND RESPOND TO TL1A-DR3 SIGNALING
- PMID: 22348196
- PMCID: PMC3279928
- DOI: 10.1556/EuJMI.1.2011.1.9
CD161 DEFINES EFFECTOR T CELLS THAT EXPRESS LIGHT AND RESPOND TO TL1A-DR3 SIGNALING
Abstract
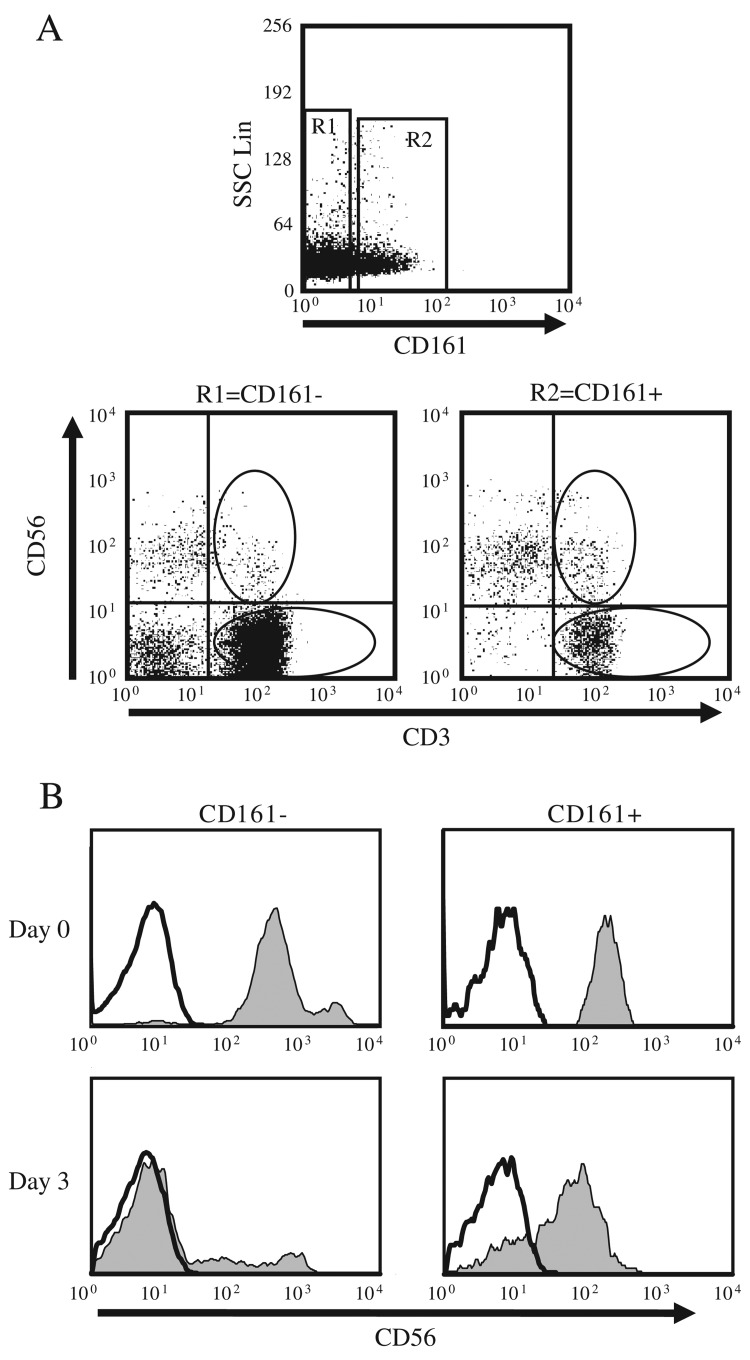
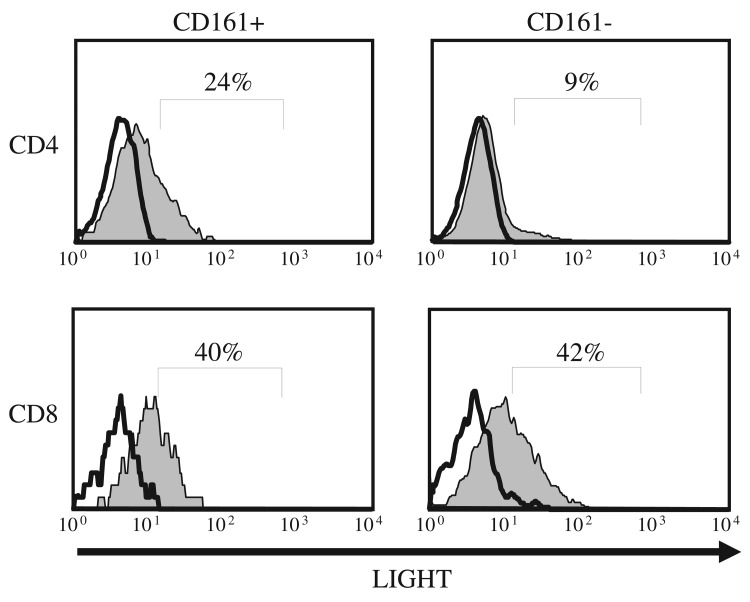
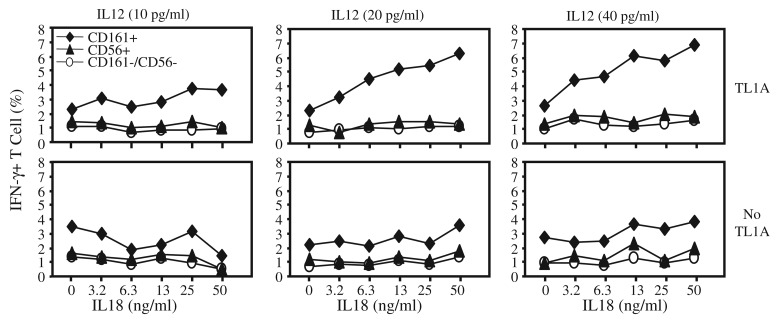
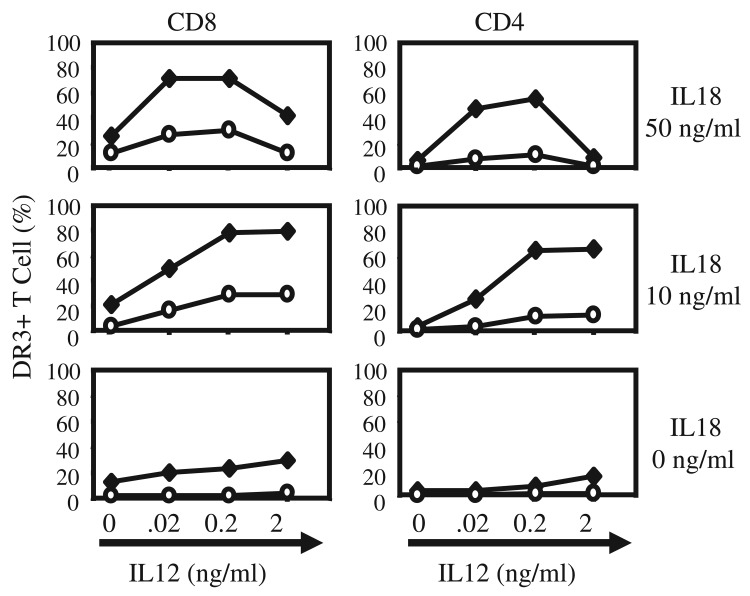
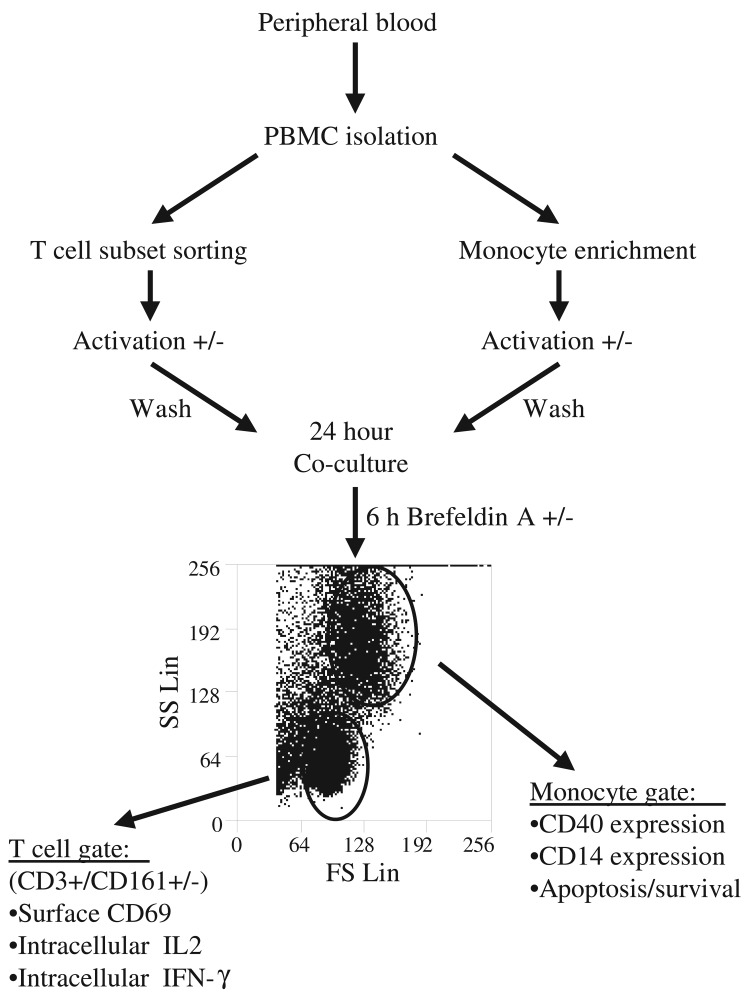
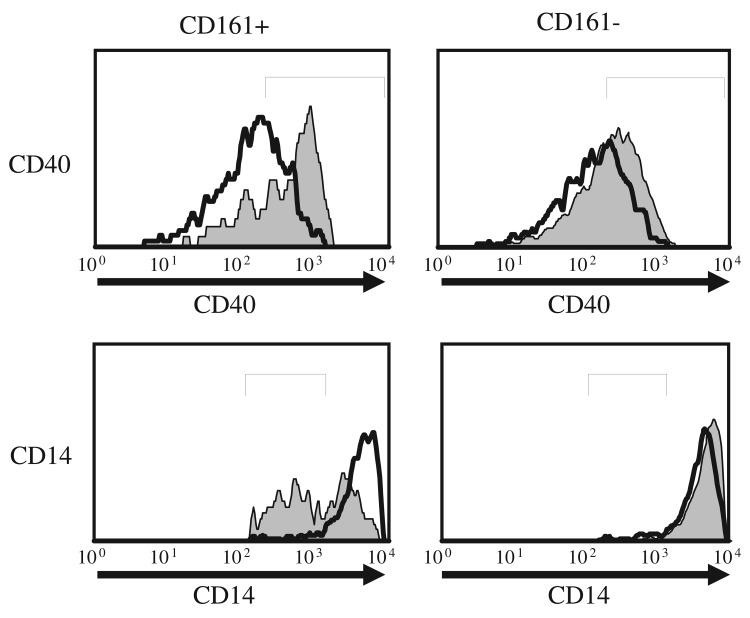
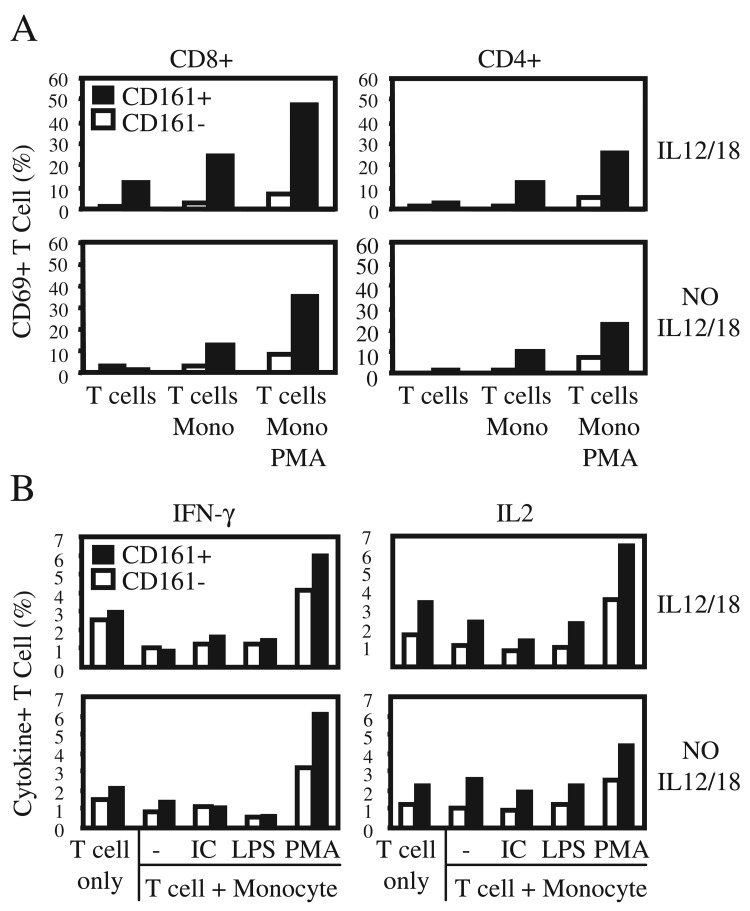
Expression of NK cell markers identifies pro-inflammatory T cell subsets in the liver and intestinal immune compartments. Specifically, CD161 is expressed on Th17 cells which play an important role in the regulation of mucosal inflammation. In this study, we characterized human peripheral blood CD161+ T cells as an effector population partially resembling a gut T cell phenotype. CD161+ CD4+ T cells express the gut-associated TNF family member, LIGHT, and respond to crosslinking of DR3, a receptor to another gut-associated cytokine, TL1A. Robust IFN-γ production in response to DR3 signaling correlated with enhanced expression of surface DR3 on CD161+ T cells and co-stimulation with IL12 and IL18. CD161+ T cell effector function was directly demonstrated by activation of responder monocytes in co-culture leading to CD40 upregulation and CD14 downregulation. CD161+ T cells reciprocally responded to activated monocytes, inducing expression of activation marker, CD69, and production of IL2 and IFN-γ, further demonstrating effective CD161+ T cell cross-talk with monocytes. Finally, CD161 defined a subset of T cells that co-express CD56, a second NK marker. Our findings implicate human CD161+ T cells in gut-associated signaling mechanisms, and suggest a monocyte mediated effector function in mucosal inflammation.
Figures
Similar articles
-
Tumor Necrosis Factor-like Cytokine TL1A and Its Receptors DR3 and DcR3: Important New Factors in Mucosal Homeostasis and Inflammation.Inflamm Bowel Dis. 2015 Oct;21(10):2441-52. doi: 10.1097/MIB.0000000000000492. Inflamm Bowel Dis. 2015. PMID: 26099067 Review.
-
Dominant role for TL1A/DR3 pathway in IL-12 plus IL-18-induced IFN-gamma production by peripheral blood and mucosal CCR9+ T lymphocytes.J Immunol. 2005 Apr 15;174(8):4985-90. doi: 10.4049/jimmunol.174.8.4985. J Immunol. 2005. PMID: 15814728
-
Enhanced Th1/Th17 Functions of CD161+ CD8+ T Cells in Mucosal Tissues of Rhesus Macaques.PLoS One. 2016 Jun 16;11(6):e0157407. doi: 10.1371/journal.pone.0157407. eCollection 2016. PLoS One. 2016. PMID: 27309719 Free PMC article.
-
TL1A (TNFSF15) and DR3 (TNFRSF25): A Co-stimulatory System of Cytokines With Diverse Functions in Gut Mucosal Immunity.Front Immunol. 2019 Mar 27;10:583. doi: 10.3389/fimmu.2019.00583. eCollection 2019. Front Immunol. 2019. PMID: 30972074 Free PMC article. Review.
-
Inflammaging phenotype in rhesus macaques is associated with a decline in epithelial barrier-protective functions and increased pro-inflammatory function in CD161-expressing cells.Geroscience. 2019 Dec;41(6):739-757. doi: 10.1007/s11357-019-00099-7. Epub 2019 Nov 11. Geroscience. 2019. PMID: 31713098 Free PMC article.
Cited by
-
TNFSF15 Modulates Neovascularization and Inflammation.Cancer Microenviron. 2012 Dec;5(3):237-47. doi: 10.1007/s12307-012-0117-8. Epub 2012 Jul 26. Cancer Microenviron. 2012. PMID: 22833050 Free PMC article.
-
The TNF-family cytokine TL1A: from lymphocyte costimulator to disease co-conspirator.J Leukoc Biol. 2015 Sep;98(3):333-45. doi: 10.1189/jlb.3RI0315-095R. Epub 2015 Jul 17. J Leukoc Biol. 2015. PMID: 26188076 Free PMC article. Review.
-
The delay in the development of experimental colitis from isomaltosyloligosaccharides in rats is dependent on the degree of polymerization.PLoS One. 2012;7(11):e50658. doi: 10.1371/journal.pone.0050658. Epub 2012 Nov 29. PLoS One. 2012. PMID: 23209802 Free PMC article.
-
SUSTAINED TL1A (TNFSF15) EXPRESSION ON BOTH LYMPHOID AND MYELOID CELLS LEADS TO MILD SPONTANEOUS INTESTINAL INFLAMMATION AND FIBROSIS.Eur J Microbiol Immunol (Bp). 2013 Mar;3(1):11-20. doi: 10.1556/EuJMI.3.2013.1.2. Eur J Microbiol Immunol (Bp). 2013. PMID: 23638306 Free PMC article.
-
A major population of mucosal memory CD4+ T cells, coexpressing IL-18Rα and DR3, display innate lymphocyte functionality.Mucosal Immunol. 2015 May;8(3):545-58. doi: 10.1038/mi.2014.87. Epub 2014 Oct 1. Mucosal Immunol. 2015. PMID: 25269704 Free PMC article.
References
-
- Targan SR, Deem RL, Liu M, Wang S, Nel A. Definition of a lamina propria T cell responsive state. Enhanced cytokine responsiveness of T cells stimulated through the CD2 pathway. J Immunol. 1995 Jan 15;154(2):664–675. - PubMed
-
- Targan SR, Hanauer SB, van Deventer SJ, Mayer L, Present DH, Braakman T, DeWoody KL, Schaible TF, Rutgeerts PJ. A short-term study of chimeric monoclonal antibody cA2 to tumor necrosis factor alpha for Crohn's disease. Crohn's Disease cA2 Study Group. N Engl J Med. 1997 Oct 9;337(15):1029–1035. - PubMed
Grants and funding
LinkOut - more resources
Full Text Sources
Research Materials
Miscellaneous