. 2012 Feb 20;13(2):R10.
doi: 10.1186/gb-2012-13-2-r10.

Autosomal monoallelic expression in the mouse

Affiliations

Autosomal monoallelic expression in the mouse

Lillian M Zwemer et al. Genome Biol. .

Abstract

Background: Random monoallelic expression defines an unusual class of genes displaying random choice for expression between the maternal and paternal alleles. Once established, the allele-specific expression pattern is stably maintained and mitotically inherited. Examples of random monoallelic genes include those found on the X-chromosome and a subset of autosomal genes, which have been most extensively studied in humans. Here, we report a genome-wide analysis of random monoallelic expression in the mouse. We used high density mouse genome polymorphism mapping arrays to assess allele-specific expression in clonal cell lines derived from heterozygous mouse strains.

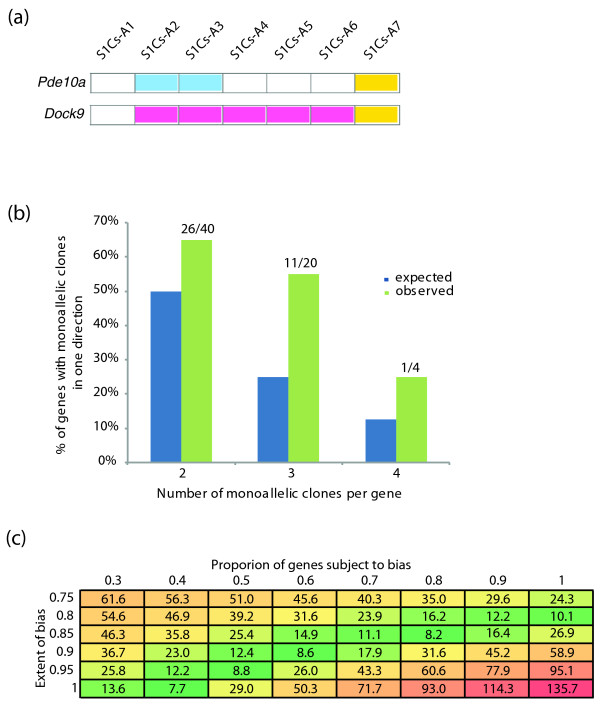
Results: Over 1,300 autosomal genes were assessed for allele-specific expression, and greater than 10% of them showed random monoallelic expression. When comparing mouse and human, the number of autosomal orthologs demonstrating random monoallelic expression in both organisms was greater than would be expected by chance. Random monoallelic expression on the mouse autosomes is broadly similar to that in human cells: it is widespread throughout the genome, lacks chromosome-wide coordination, and varies between cell types. However, for some mouse genes, there appears to be skewing, in some ways resembling skewed X-inactivation, wherein one allele is more frequently active.

Conclusions: These data suggest that autosomal random monoallelic expression was present at least as far back as the last common ancestor of rodents and primates. Random monoallelic expression can lead to phenotypic variation beyond the phenotypic variation dictated by genotypic variation. Thus, it is important to take into account random monoallelic expression when examining genotype-phenotype correlation.


Figures

Figure 1
Figure 1
Assessment of random monoallelic expression. (a) Examples of X-chromosome inactivation in clonal cell lines from females. Each column represents an individual clone and each row represents an individual SNP within a known gene. Inset is the key for color coding. By focusing our analyses on the X-chromosome rather than autosomes, we can observe the expected chromosome-wide inactivation of one of the two X-chromosomes. (b) Examples of random monoallelic expression (RMAE) in autosomal genes. Colors have the same meaning as in (a). To be 'assessed,' a gene had to have either a G-score > 1 (classified as RMAE class I), equal to 1 (RMAE class II), or a G-score of 0 with 2 or more informative clones (classified as biallelic expression). See detailed explanation in Note 4 in Additional file 1. (c) Validation of RMAE calls with Sanger sequencing of cDNA from clonal cell lines. Comparison against the gDNA relative allelic balance is necessary to ensure that allelic imbalance seen in the nuclear cDNA did not result from PCR bias or loss of heterozygosity. The extent of allelic bias shown above (heterozygosity in the gDNA contrasted with an extreme allelic imbalance in the cDNA) is typical of RMAE genes. At the bottom is the summary of validation for randomly selected RMAE genes. Additional genes were also validated and these results, along with details on all validation experiments, are found in Table S2 in Additional file 1.
Figure 2
Figure 2
Random monoallelic expression in the mouse genome. (a) Assessed genes. Based on the identity of SNP probes present on the array and the genotypes of mice used, a total of 4,361 genes contained at least one heterozygous assessable SNP within exons or introns. The actual number assessed (shown in grey) was lower, since not all genes were expressed in the given cell type and not all SNPs passed the stringent quality control filters, which maximize specificity at the cost of sensitivity. Among these 1,358 assessed genes, 212 demonstrate random monoallelic expression (RMAE; dark green is RMAE class I, light green is RMAE class II, yellow is biallelic expression). The mean number of SNPs assessed per gene is 1.53 and the most common number of SNPs assessed per gene (mode) is 1. (b) Map of assessed genes on the mouse autosomes. Biallelic and RMAE genes identified in this study are located throughout the autosomes. Yellow indicates biallelic genes, light green represents class II RMAE genes and dark green indicates a class I RMAE gene. (c) Individual clones show unique patterns of monoallelic expression. A representative autosome, chromosome 2, is shown - all autosomes show a similar diversity of expression states. There is no coordination along the chromosome in terms of the direction of monoallelic expression. Individual clones show distinct patterns of allelic expression along the length of the chromosome, including biallelic expression.
Figure 3
Figure 3
Comparison of random monoallelic expression in human and mouse genomes. (a) Human and mouse random monoallelic expression (RMAE). Of all orthologous gene pairs between mouse and human, there were 529 for which the gene was assessed (as either biallelic expression, RMAE class I or RMAE class II) in each organism. Of these orthologs, 66 were RMAE in mouse and 29 were RMAE in human, resulting in a subset of 15 genes that were assessed as RMAE in both organisms. (b) The number of assessed orthologs showing RMAE in both species is greater than would be expected by chance (Note 6 in Additional file 1). The observed and expected overlaps are shown as subsets of the gray bars, which represent the maximum possible overlap, as defined by the total number of RMAE genes (29) observed in human (for an overlap of 15 or more genes; hypergeometric P < 2 × 10⁻⁷).
Figure 4
Figure 4
Skewed monoallelic expression in the mouse. (a) Examples of genes with apparent skewed monoallelic expression. Same display conventions as Figure 1a. For a subset of random monoallelic expression (RMAE) genes, such as those shown here, we only observed RMAE in one direction (either monoallelic maternal or monoallelic paternal). (b) Skewed genes. For any given gene, the number of clones is too low to make an observation of skewed RMAE significant. When considering the genome-wide data, however, it becomes apparent that an observation of bias in the direction of RMAE occurs more often than can be explained by chance. When examining genes that show RMAE in only one direction, we can compare the number of genes observed (green) to that which would be expected by chance (blue) for genes with two, three or four monoallelic clones. In each case, the number of genes with RMAE clones solely in one direction is higher than expected (two clones, P = 1.92 × 10⁻²; three clones, P = 9 × 10⁻⁴). See main text and Note 6 in Additional file 1 for details. (c) The observed skewed RMAE is consistent with a range of simple models. By varying the percentage of genes subject to skewed RMAE, and by varying the probability of seeing one allele rather than the other allele for those genes with skewed RMAE, we estimated how closely simple models approximate the observed numbers of genes with monoallelic clones all in one direction. Shown in each cell is the sum of squares of differences between the observed and expected number of genes with two, three, and four clones all in one direction; the smaller the value is, the more closely the model approximates the actual observed values.
Figure 5
Figure 5
Clone-specific monoallelic expression and tissue-scale allelic imbalance. Allelic imbalance has been noted for a variety of genes in different tissues and is typically attributed to either parent-of-origin imprinting or to cis-regulatory variants. Skewed random monoallelic expression (RMAE), when one allele is preferentially chosen for expression, could also result in a tissue-wide allelic imbalance. In a traditional view (left) the expression level varies between the two alleles, with the paternal (pat) allele contributing more. This is uniformly true among the cells in the tissue. By contrast, in the scenario depicted at right, a difference in the relative abundance of cells with different RMAE states results in a tissue-scale allelic imbalance. Mat, maternal; Pat, paternal.

Similar articles

Cited by

References

    1. Reik W, Walter J. Genomic imprinting: parental influence on the genome. Nat Rev Genet. 2001;2:21–32. - PubMed
    1. Lyon MF. Gene action in the X-chromosome of the mouse (Mus musculus L.). Nature. 1961;190:372–373. doi: 10.1038/190372a0. - DOI - PubMed
    1. Chess A, Simon I, Cedar H, Axel R. Allelic inactivation regulates olfactory receptor gene expression. Cell. 1994;78:823–834. doi: 10.1016/S0092-8674(94)90562-2. - DOI - PubMed
    1. Hollander GA, Zuklys S, Morel C, Mizoguchi E, Mobisson K, Simpson S, Terhorst C, Wishart W, Golan DE, Bhan AK, Burakoff SJ. Monoallelic expression of the interleukin-2 locus. Science. 1998;279:2118–2121. doi: 10.1126/science.279.5359.2118. - DOI - PubMed
    1. Pernis B, Chiappino G, Kelus AS, Gell PG. Cellular localization of immunoglobulins with different allotypic specificities in rabbit lymphoid tissues. J Exp Med. 1965;122:853–876. doi: 10.1084/jem.122.5.853. - DOI - PMC - PubMed

Publication types