Comparative Study
. 2012 Jul;69(13):2261-77.
doi: 10.1007/s00018-012-0927-3. Epub 2012 Feb 16.

Identification of functional differences between recombinant human α and β cardiac myosin motors

Affiliations
Comparative Study

Identification of functional differences between recombinant human α and β cardiac myosin motors

John C Deacon et al. Cell Mol Life Sci. 2012 Jul.

Erratum in

Abstract

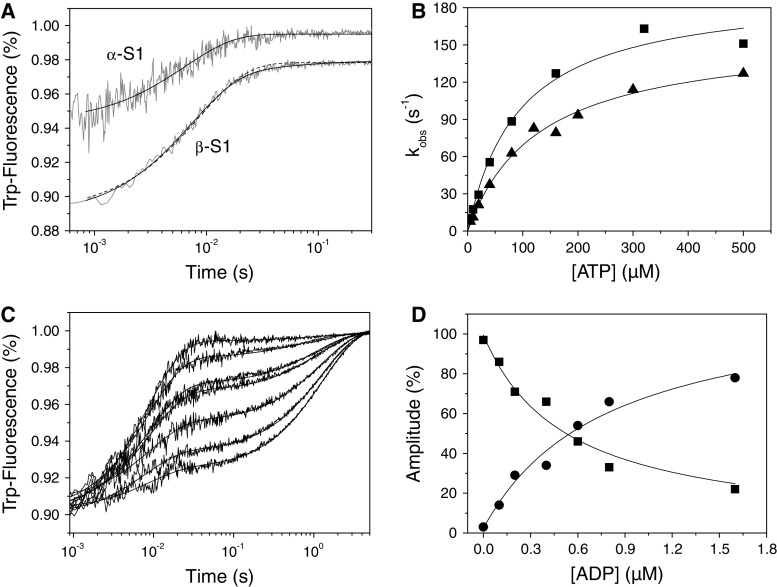
The myosin isoform composition of the heart is dynamic in health and disease and has been shown to affect contractile velocity and force generation. While different mammalian species express different proportions of α and β myosin heavy chain, healthy human heart ventricles express these isoforms in a ratio of about 1:9 (α:β) while failing human ventricles express no detectable α-myosin. We report here fast-kinetic analysis of recombinant human α and β myosin heavy chain motor domains. This represents the first such analysis of any human muscle myosin motor and the first of α-myosin from any species. Our findings reveal substantial isoform differences in individual kinetic parameters, overall contractile character, and predicted cycle times. For these parameters, α-subfragment 1 (S1) is far more similar to adult fast skeletal muscle myosin isoforms than to the slow β isoform despite 91% sequence identity between the motor domains of α- and β-myosin. Among the features that differentiate α- from β-S1: the ATP hydrolysis step of α-S1 is ~ten-fold faster than β-S1, α-S1 exhibits ~five-fold weaker actin affinity than β-S1, and actin·α-S1 exhibits rapid ADP release, which is >ten-fold faster than ADP release for β-S1. Overall, the cycle times are ten-fold faster for α-S1 but the portion of time each myosin spends tightly bound to actin (the duty ratio) is similar. Sequence analysis points to regions that might underlie the basis for this finding.


Conflict of interest statement

The authors declare that they have no conflict of interest.

Figures

Fig. 1
Fig. 1
Myosin contractile cycle. Myosin motors shown graphically interacting with actin filaments and nucleotides as is modeled to occur in the contractile cycle. ATP, ADP, and phosphate are represented by T, D, and Pi, respectively. Strong actin–myosin binding is indicated by black motor domains and low actin-affinity states by white motor domains. Steps occurring while bound to actin are indicated as step 1′–5′, and those while detached from actin as step 1–5. The highlighted path is the main active contractile cycle. Steps 1 and 1′ are dependent upon the equilibrium constants of ATP binding K 1 and K1, respectively. Steps 2 and 2′ are dependent upon the rate constants of a conformational change in the motor domain associated with loss of actin affinity k +2 and k+2 respectively. Step 3 is dependent upon the rate constant of ATP hydrolysis k +3 + k −3. Steps 4 and 4′ are dependent upon the rate constants of Pi release k +4 and formula image respectively. Step 5 and 5′ are dependent upon the rate constants of ADP release k −ADP and formula image, respectively. Dissociation of myosin from actin in the absence of nucleotide is governed by the dissociation constant K A. Dissociation of myosin from actin in the presence of ADP is governed by the dissociation constant K DA. Dissociation of myosin from actin after Step 2′ is essentially diffusion-limited
Scheme 1
Scheme 1
Fig. 2
Fig. 2
a Recombinant human α- and β-S1 proteins are C-terminally 6xHis affinity tagged for purification and copurify with C2C12 LCs. By coexpressing N-terminally affinity-tagged human ventricular ELC isoform MYL3 with untagged β-sS1 a humanized subfragment of MyHC can be purified. b SDS-PAGE of purified recombinant MyHC proteins. Lane 1 contains Precision Plus Protein™ Dual Color Standards. ~98-kDa S1 proteins in lanes 2 and 3 copurify with mouse ELC and RLC isoforms at <20 kDa and ~22 kDa. In lane 3, β-sS1 and MYL3 copurify at ~93 and 25 kDa, respectively. c SDS-PAGE of cardiac myosin and S1 purified from mouse heart. Full-length myosin (1st lane) copurifies with both ELC and RLC. Chymotryptic S1 purifies with only ELC
Fig. 3
Fig. 3
ATP-binding to actin·S1 (α- or β-isoform). The ATP-binding properties of the recombinant human α- and β-S1 proteins with actin present were investigated using stopped flow measurements. a After rapidly mixing 0.5 mM ATP with 0.1 μM pyrene-actin·S1, for both cardiac S1 isoforms the pyrene fluorescence transient is best described by a two exponential fit. For the fast phase, the observed rate constant was (k obs) = 658 s−1 (amp = 21%) for α and k obs = 436 s−1 (amp = 31%) for β, whereas for the slow phase, a similar k obs was found for both isoforms, k obs = 61 s−1 (amp = 2.2%) for α and 64 s−1 (amp = 5%) for β. b For both α- and β-S1 the k obs of the fast phase showed a hyperbolic dependence on ATP concentration. At high [ATP], k obs for the fast phase (= formula image ) saturates at 1,667 for α (filled square) and at 1,432 s−1 for β (filled triangle) with a half maximal k obs at 769 and 1,075 μM ATP (= 1/formula image) for α and β, respectively. The slower phase is virtually independent of ATP concentration k +α1 = 40–60 s−1 for both α (open square) and β (open triangle)
Fig. 4
Fig. 4
ATP-induced dissociation of pyrene-actin·S1 (α or β) in the presence of ADP. a 0.1 μM pyrene-labeled actin·S1 was rapidly mixed with 25 μM ATP (α) or 50 μM ATP (β) and variable ADP (20°C). The data were fitted to a single exponential, and k rel (= k obs/k 0 where k 0 = k obs with [ADP] = 0) was plotted against [ADP]. Fitting the data to k rel = 1/(1 + [ADP]/formula image), resulting in an apparent affinity (formula image    = 127 ± 16 μM for α-S1 (filled square) and 23 ± 3 μM for β-S1 (filled triangle). Table 1 shows the average value of K5 (n = 3). b 0.5 μM actin·β-S1 was pre-incubated with 100 μM ADP and then rapidly mixed with a large excess of ATP (4 mM ATP). The resulting pyrene fluorescence transient was best described by a two exponential fit (solid line). For comparison, a single exponential fit is also shown (grey line). The fast component with k obs = 84 s−1 (amp +38%) defined the rate constant of ADP release (formula image) whereas the slower phase defines the rate constant of nucleotide pocket opening to allow ADP release k +αD 15.9 s−1 (amp +6%). c Temperature dependence of ATP induced dissociation of actin·β-S1 in the presence of ADP as in Fig. 4b with k obs (fast (filled triangle) formula image   and slow (open triangle) k +αD phase) as a function of temperature. From the slope the activation energy can be calculated. E a = 89.8 and 38 kJmol−1 for the fast and the slow phase, respectively. d ATP-induced dissociation of actin·α-S1 in the presence (filled square) or absence (open square) of 125 μM ADP at 12°C. A hyperbolic fit gives at high [ATP] similar maximum rate constants for the dissociation of actin·α-S1 in the presence or absence of ADP (formula image  = 754 and 837 s−1 respectively), indicating that ADP does not limit the maximum rate constant for α-S1
Fig. 5
Fig. 5
Titration of actin with cardiac myosin isoforms. a Fluorescence transients observed when 20 μM ATP was used to dissociate 30 nM actin from increasing concentrations of β-S1. The fluorescence was fitted to a single exponential, the k obs (= 18 s−1) was constant and the amplitude increased with increasing [S1]. b A plot of the amplitudes in A versus [β-S1] (open triangle) and similar data for β-S1 in the presence of 500 μM ADP (filled triangle). Note that plotted concentrations are before mixing. The result was fitted to the quadratic equation describing the binding isotherm (see “Experimental” section) resulted in a K A = 8 nM and K DA = 190 nM for β-S1. c Example traces used for the results in (d): 30 nM actin was incubated with 400 nM α-S1 or 400 nM α-S1·ADP before rapidly mixing with 20 μM ATP or 250 μM ATP. Without ADP the fluorescence transient was fitted to a single exponential with k obs = 29 s−1 and Amp = 30%. In the presence of ADP the fluorescence transient, fitted to a single exponential, resulted in k obs = 66 s−1 and Amp = 11%. The large difference in measured fluorescence amplitude is due to the weak affinity of α-S1-ADP for actin. d A similar plot as B for α-S1 (open square) and α-formula image (filled square) in which ADP was 1 mM resulting in K A = 44 nM and K DA = 2.4 μM. Plotted concentrations are before mixing. Table 1 gives the average values of 2–3 independent measurements of K A and K DA
Fig. 6
Fig. 6
Binding of ATP or ADP to cardiac S1. a Tryptophan fluorescence traces observed upon rapidly mixing 0.2 μM α- or β-S1 with 500 μM ATP. For α-S1 the fluorescence traces were best fit by a single exponential, k obs = 151 s−1 (amp = 5.1%), whereas for β-S1 the fluorescence traces (offset by −0.02) were best fit by a double exponential (solid line), k obs = 124 s−1 (amp = 8.4%) and 19 s−1 (amp = 0.8%). Note that a single exponential fit (dashed line k obs = 117 s−1) is also shown for comparison. b The dependence of k obs on [ATP] yields K 1 k +2 = 2.7 μM−1 s−1 for α-S1 (filled square) and K 1 k +2 = 1.23 μM−1 s−1 for the fast phase of β-S1 (filled triangle). At high ATP-concentrations k obs saturates at 196 s−1 (α-S1) and 158 s−1 (β-S1). The slow phase measured for β-S1 saturates at ~26 s−1. c Tryptophan fluorescence traces observed after incubating 0.2 μM β-S1 with variable [ADP] (0–1.6 μM) before rapidly mixing with 100 μM ATP. The data fit best to a sum of two exponentials with k obs = 112 s−1 (fast phase) and 0.8 s−1 (slow phase). d Dependence of the relative amplitudes of the two exponentials measured in Fig. 6c on ADP concentration (before mixing). The data are fitted to Eqs. 5A and 5B (“Experimental” section) with a K 5 = 0.53 μM (fast phase, filled square) and 0.8 μM (slow phase, filled circle)
Fig. 7
Fig. 7
Comparison of the rate and equilibrium constants for myosin S1 relative to those of Human β-S1. The values listed in Table 1 which discriminate between the α and β isoforms were divided by the equivalent value for human β-S1 and plotted on a log scale. Values contained between the two horizontal lines are within a factor of 2 of the values for human β-S1. This region contains almost all of the human and bovine β-S1 and bovine β-S1 isoform data and excludes all of the α-S1 and rabbit skeletal S1 data. All values plotted for the human and mouse α isoforms lie outside this range and are at least three-fold larger than the value for β-S1. Values for Rabbit skeletal S1 are shown for comparison and are similar to the α isoform values in each case. Other values in Table 1 are within a factor of 2 of the human β-S1 values for all isoforms

Similar articles

Cited by

References

    1. Geeves MA, Holmes KC. Structural mechanism of muscle contraction. Annu Rev Biochem. 1999;68:687–728. doi: 10.1146/annurev.biochem.68.1.687. - DOI - PubMed
    1. Taylor RS, Weeds AG. The magnesium-ion-dependent adenosine triphosphatase of bovine cardiac myosin and its subfragment-1. Biochem J. 1976;159(2):301–315. - PMC - PubMed
    1. Stone D, Perry SV. Studies on the heterogeneity of subfragment-1 preparations. Isolation of a new proteolytic fragment of the heavy chain of myosin. Biochem J. 1973;131(1):127–137. - PMC - PubMed
    1. Weiss A, Schiaffino S, Leinwand LA. Comparative sequence analysis of the complete human sarcomeric myosin heavy chain family: implications for functional diversity. J Mol Biol. 1999;290(1):61–75. doi: 10.1006/jmbi.1999.2865. - DOI - PubMed
    1. VanBuren P, Harris DE, Alpert NR, Warshaw DM. Cardiac V1 and V3 myosins differ in their hydrolytic and mechanical activities in vitro. Circ Res. 1995;77(2):439–444. doi: 10.1161/01.RES.77.2.439. - DOI - PubMed

Publication types