. 2012 Mar 1;125(Pt 5):1165-76.
doi: 10.1242/jcs.091157. Epub 2012 Feb 20.

Diffusion, capture and recycling of SCAR/WAVE and Arp2/3 complexes observed in cells by single-molecule imaging

Affiliations

Diffusion, capture and recycling of SCAR/WAVE and Arp2/3 complexes observed in cells by single-molecule imaging

Arthur Millius et al. J Cell Sci. .

Abstract

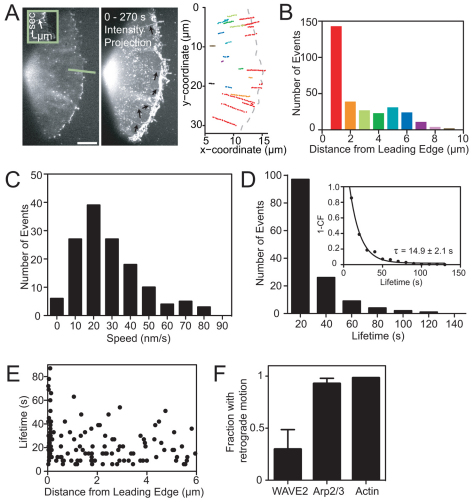
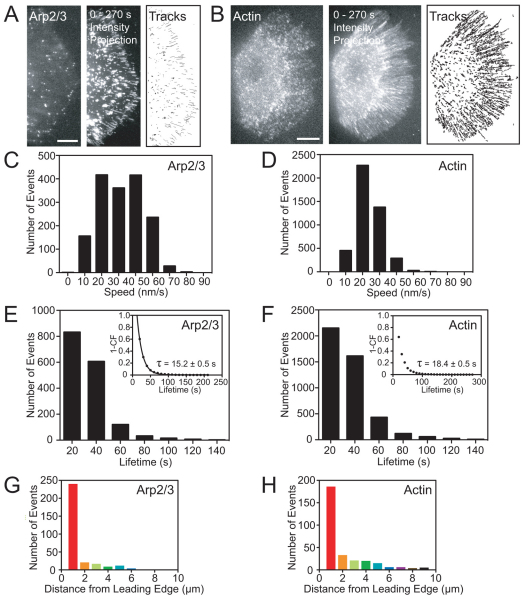
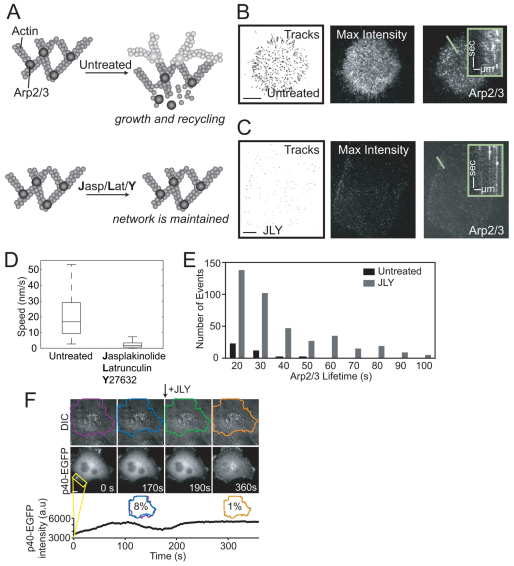
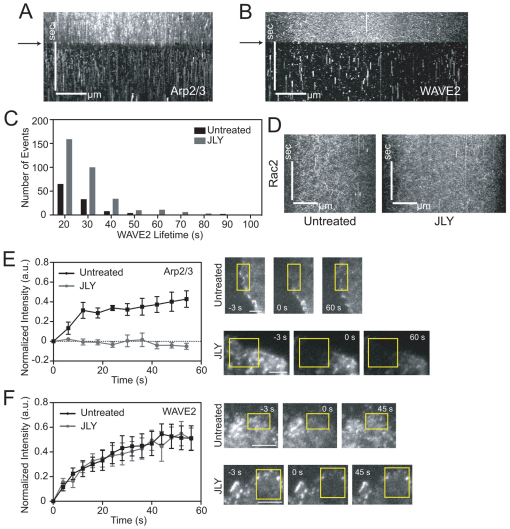
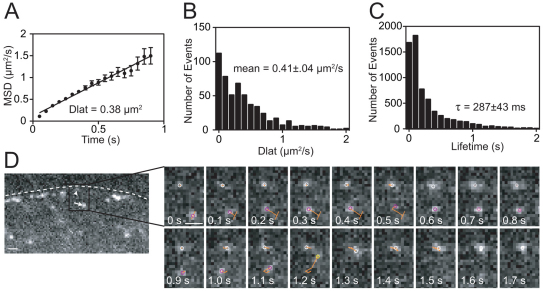
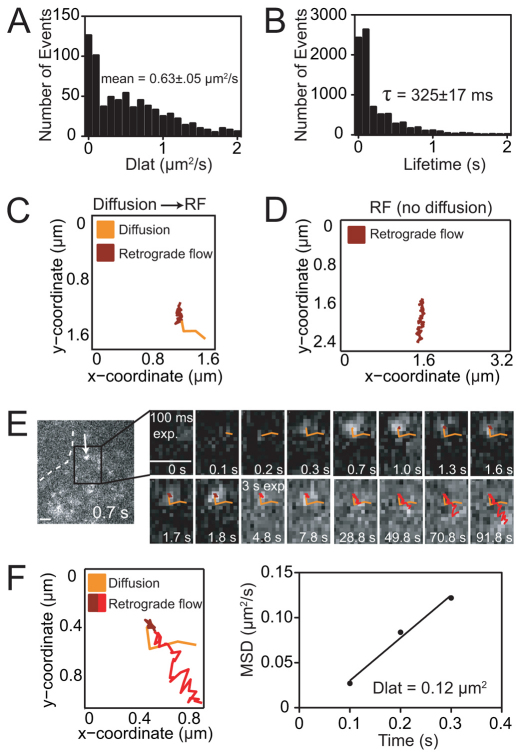
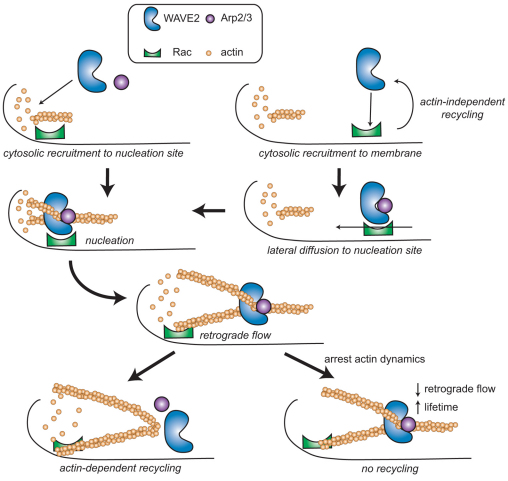
The SCAR/WAVE complex drives lamellipodium formation by enhancing actin nucleation by the Arp2/3 complex. Phosphoinositides and Rac activate the SCAR/WAVE complex, but how SCAR/WAVE and Arp2/3 complexes converge at sites of nucleation is unknown. We analyzed the single-molecule dynamics of WAVE2 and p40 (subunits of the SCAR/WAVE and Arp2/3 complexes, respectively) in XTC cells. We observed lateral diffusion of both proteins and captured the transition of p40 from diffusion to network incorporation. These results suggest that a diffusive 2D search facilitates binding of the Arp2/3 complex to actin filaments necessary for nucleation. After nucleation, the Arp2/3 complex integrates into the actin network and undergoes retrograde flow, which results in its broad distribution throughout the lamellipodium. By contrast, the SCAR/WAVE complex is more restricted to the cell periphery. However, with single-molecule imaging, we also observed WAVE2 molecules undergoing retrograde motion. WAVE2 and p40 have nearly identical speeds, lifetimes and sites of network incorporation. Inhibition of actin retrograde flow does not prevent WAVE2 association and disassociation with the membrane but does inhibit WAVE2 removal from the actin cortex. Our results suggest that membrane binding and diffusion expedites the recruitment of nucleation factors to a nucleation site independent of actin assembly, but after network incorporation, ongoing actin polymerization facilitates recycling of SCAR/WAVE and Arp2/3 complexes.


Figures

Fig. 1.
Fig. 1.
Single-molecule epifluorescence imaging demonstrates retrograde flow of WAVE2 in XTC cells. (A) Fluorescence image (left) of an XTC cell expressing a low concentration of WAVE2–EGFP. Some molecules undergo smooth and continuous retrograde flow (inset, kymograph bars: horizontal, 1 μm; vertical, 1 min; time flows top to bottom). Middle panel shows maximum intensity projection (90 frames, 4.5 minutes) of this cell. Arrows indicate retrograde flow events. Corresponds to supplementary material Movie 1. Trajectories of retrograde flowing molecules are shown on the right. Color corresponds to histogram in B and indicates the distance to the leading edge when the molecule first appears. Scale bar: 5 μm. (B) Initial positions of appearance for retrograde WAVE2 molecules as a function of distance from the leading edge (n=304, nine cells). (C) Distribution of WAVE2 retrograde velocities with a mean speed of 31±18 nm/second (n=345, nine cells). (D) Lifetime distribution of WAVE2 molecules (n=345, nine cells) that appear over the course of a 90 second time window. Single exponential fit of 1-cumulative frequency (CF) of WAVE2 lifetimes gives a mean lifetime (τ) of 14.9±2.1 seconds (inset). (E) Lifetime versus position plot for WAVE2 molecules. Dots represent the lifetime and emerging position of individual WAVE2 molecules (n=143, six cells). (F) Fraction of fluorescent WAVE2 (19%, n=1810, nine cells), p40 (93%, n=3068, three cells), and actin (98%, n=4503, three cells) molecules undergoing retrograde flow. Error bars are s.d.
Fig. 2.
Fig. 2.
Actin and p40 retrograde flow is similar to WAVE2 retrograde flow. (A) Left panel shows epifluorescence image of an XTC cell expressing a low concentration of EGFP-tagged p40 subunit of the Arp2/3 complex (corresponds to supplementary material Movie 3). Scale bar: 5 μm. Middle panel shows maximum intensity projection (90 frames, 4.5 minutes) of this cell, and right panel shows the trajectories of retrograde flowing molecules. (B) Left panel shows fluorescence image of an XTC cell expressing a low concentration of EGFP–actin (corresponds to supplementary material Movie 4). Scale bar: 5 μm. Middle panel shows maximum intensity projection (90 frames, 4.5 minutes) of this cell, and right panel shows trajectories of retrograde flowing molecules. (C) Distribution of p40 retrograde velocities with a mean speed of 30±13 nm/second (n=1696, three cells). (D) Distribution of actin retrograde velocities with a mean speed of 24±8 nm/second (n=4503, three cells). (E) Lifetime distribution of p40 molecules (n=1696, three cells) that appear over the course of a 90 second time window. Four speckles had lifetimes longer than 140 seconds; the longest speckle lifetime was 200 seconds. Single exponential fit of 1-CF of p40 lifetimes (τ=15.2±0.5 seconds, inset). (F) Lifetime distribution of actin molecules (n=4503, three cells) that appear over the course of a 90 second time window. Fourteen speckles had lifetimes longer than 140 seconds; the longest speckle lifetime was 280 seconds. Single exponential fit of 1-CF of actin lifetimes (τ=18.4±0.5 seconds, inset). (G,H) Initial positions of appearance for retrograde moving p40 (G, n=304, three cells) and actin (H, n=304, three cells) molecules as a function of distance from the leading edge.
Fig. 3.
Fig. 3.
p40 recycling depends on actin dynamics. (A) XTC cells were treated with a drug cocktail that inhibits both actin polymerization and network turnover. Cells were pretreated for 30 minutes with 10 μM Y27632 (Y) and then acutely treated with 20 μM jasplakinolide (J) and 20 μM latrunculinB (L). Small circles represent actin and large circles represent the Arp2/3 complex. Dark gray shows the existing network, and new network growth is shown in light gray. (B) Left panel shows trajectories of retrograde flowing molecules from an XTC cell expressing a low concentration of p40–EGFP. Middle panel shows maximum intensity projection (90 frames, 4.5 minutes) of this cell, and right panel shows a single TIRF image of the cell. Diagonal streaks in the inset kymograph show most molecules undergo smooth and continuous retrograde flow (inset bars: horizontal, 2 μm; vertical, 1 minute; time flows top to bottom). Scale bar: 10 μm. (C) Left panel shows trajectories of retrograde flowing molecules from a cell expressing p40–EGFP treated with JLY cocktail described in A. Middle panel shows maximum intensity projection (90 frames, 4.5 minutes) of this cell, and right panel shows a single TIRF image of the cell. Vertical streaks in the inset kymograph indicate that freezing actin dynamics causes p40 to cease retrograde flow (inset bars: horizontal, 2 μm; vertical, 1 minute; time flows top to bottom). Scale bar: 10 μm. (D) p40 retrograde flow speed is reduced in JLY-treated cells (mean=3 nm/second) compared with untreated cells (mean=18 nm/second), indicating a drug-dependent block of retrograde flow. (E) p40 lifetime increases after drug addition, indicating stabilization of the existing actin network (before, n=37; after, n=397). (F) An XTC cell expressing p40–EGFP imaged in DIC (top) and GFP (middle) was treated at 180 seconds with JLY cocktail. A section of the lamellipodium (yellow box) was measured for protrusion and retraction over time and the cell boundary was measured at each frame for area of overlap with previous frames (bottom). Percentages inside colored cell traces indicate the difference in overlap between indicated frames. Corresponds to supplementary material Movie 5. Scale bar: 5 μm.
Fig. 4.
Fig. 4.
WAVE2 freely associates and dissociates with the plasma membrane until incorporation into the actin cortex. (A,B) Maximum intensity projection (180 frames, 9 minutes) of a kymograph across an XTC cell expressing p40–EGFP (A) or WAVE2–EGFP (B) before and after treatment with JLY drug cocktail. Arrow indicates drug addition. Bars: horizontal, 1 μm; vertical, 5 minutes. Time flows top to bottom. Drug treatment stabilizes both p40 and WAVE2 molecules on the membrane, as indicated by vertical streaks at time points below arrow in the kymograph. (C) Lifetime of stabilized WAVE2 molecules increases after drug treatment (before, n=113; after, n=324). (D) Maximum intensity kymograph projections of XTC cells expressing Rac2–EGFP in the absence or presence of the JLY drug cocktail. Compare with portion of kymograph in Fig. 4B above the black arrow. Bars: horizontal, 1 μm; vertical, 5 minutes. Time flows top to bottom. (E,F) FRAP to ascertain how bulk populations of Arp2/3 (E) and WAVE2 (F) behave after actin network stabilization with JLY. Cells were pretreated for 30 minutes with JLY (gray lines) or buffer (black lines). (E) p40–EGFP recovers ∼40% of its pre-bleached fluorescence (n=7), whereas cells treated with JLY do not show any recovery (n=6). (F) WAVE2–EGFP recovers similarly in both drug-treated (n=7) and untreated (n=8) cells. Representative images are shown on the right. Yellow rectangles indicate photobleached regions. Scale bars: 2.5 μm.
Fig. 5.
Fig. 5.
WAVE2–EGFP molecules diffuse at rates consistent with membrane diffusion. (A) An example of a MSD versus time lag plot for all diffusing particles in a cell expressing WAVE2–EGFP gives a mean lateral diffusion coefficient of 0.38 μm2/second (corresponds to supplementary material Movie 6). Error bars are s.e.m. (B) Histogram of WAVE2 lateral diffusion coefficients for particles that diffuse at least 20 frames (n=543, five cells) with mean diffusion coefficient of 0.41±0.04 μm2/second. (C) Lifetime distribution of diffusing WAVE2 molecules (n=6647, five cells). Single exponential fit of 1-CF (not shown) gives a mean lifetime of 287±43 mseconds. (D) Representative time-lapse image sequence of a WAVE2–EGFP molecule (arrow) diffusing and then stabilizing at the leading edge (arrowhead indicates stabilization point; corresponds to supplementary material Movie 8). Dashed line indicates cell edge. Scale bars: 1 μm.
Fig. 6.
Fig. 6.
The Arp2/3 complex transitions from lateral diffusion to retrograde flow. (A) Histogram of p40 lateral diffusion coefficients for particles that diffuse at least 20 frames (n=716, three cells) with mean diffusion coefficient of 0.63±0.05 μm2/second. An example is shown in supplementary material Movie 9. (B) Lifetime distribution of diffusing p40 molecules (n=8325, three cells). Single exponential fit of 1-CF (not shown) gives a mean lifetime of 325±17 mseconds. (C) Trajectory of a p40–EGFP molecule that laterally diffuses before transitioning to retrograde flow (corresponds to supplementary material Movie 10). Orange section of the track indicates diffusion, and maroon section indicates retrograde flow. Camera exposures occur at fast 10 frames per second (f.p.s.) imaging conditions. (D) Trajectory of a p40–EGFP molecule that undergoes retrograde motion without any prior diffusion (corresponds to supplementary material Movie 11). Exposures are 10 f.p.s. (E) Selected images from supplementary material Movie 12, which shows diffusion of a p40–EGFP molecule (first five frames, orange tracks, 10 f.p.s. imaging conditions), then retrograde motion (next five frames, maroon tracks, 10 f.p.s. imaging conditions), and then retrograde motion with 0.33 f.p.s. imaging conditions (final six frames, red tracks). The slower imaging mode is better able to capture retrograde motion. Dashed line indicates cell edge. Scale bars: 1 μm. (F) Trajectory of the p40–EGFP molecule in E. Orange section of the track shows diffusion at 10 f.p.s., maroon section indicates retrograde flow at 10 f.p.s., and red section shows retrograde flow at 0.33 f.p.s. imaging frequency (left). MSD versus time plot shows that this particle has a lateral diffusion coefficient of 0.12 μm2/second (right).
Fig. 7.
Fig. 7.
Model for SCAR/WAVE-mediated actin nucleation in cells. SCAR/WAVE and Arp2/3 complexes have two modes of recruitment to nucleation sites: through cytosol recruitment or through membrane-bound lateral diffusion. Diffusing molecules of the SCAR/WAVE complex can release from the membrane independently of actin nucleation. Once a SCAR/WAVE complex integrates into the actin meshwork after nucleation, recycling occurs through actin-based retrograde flow.

References

    1. Bear J. E., Rawls J. F., Saxe C. L. (1998). SCAR, a WASP-related protein, isolated as a suppressor of receptor defects in late Dictyostelium development. J. Cell Biol. 142, 1325–1335 - PMC - PubMed
    1. Bieling P., Laan L., Schek H., Munteanu E. L., Sandblad L., Dogterom M., Brunner D., Surrey T. (2007). Reconstitution of a microtubule plus-end tracking system in vitro. Nature 450, 1100–1105 - PubMed
    1. Chen Z., Borek D., Padrick S. B., Gomez T. S., Metlagel Z., Ismail A. M., Umetani J., Billadeau D. D., Otwinowski Z., Rosen M. K. (2010). Structure and control of the actin regulatory WAVE complex. Nature 468, 533–538 - PMC - PubMed
    1. Cramer L. P., Mitchison T. J. (1997). Investigation of the mechanism of retraction of the cell margin and rearward flow of nodules during mitotic cell rounding. Mol. Biol. Cell 8, 109–119 - PMC - PubMed
    1. de Keijzer S., Serge A., van Hemert F., Lommerse P. H. M., Lamers G. E. M., Spaink H. P., Schmidt T., Snaar-Jagalska B. E. (2008). A spatially restricted increase in receptor mobility is involved in directional sensing during Dictyostelium discoideum chemotaxis. J. Cell Sci. 121, 1750–1757 - PubMed

Publication types

Substances