

B-cell tolerance defects in the B6.Aec1/2 mouse model of Sjögren's syndrome
- PMID: 22350147
- PMCID: PMC3351565
- DOI: 10.1007/s10875-012-9663-6
B-cell tolerance defects in the B6.Aec1/2 mouse model of Sjögren's syndrome
Abstract
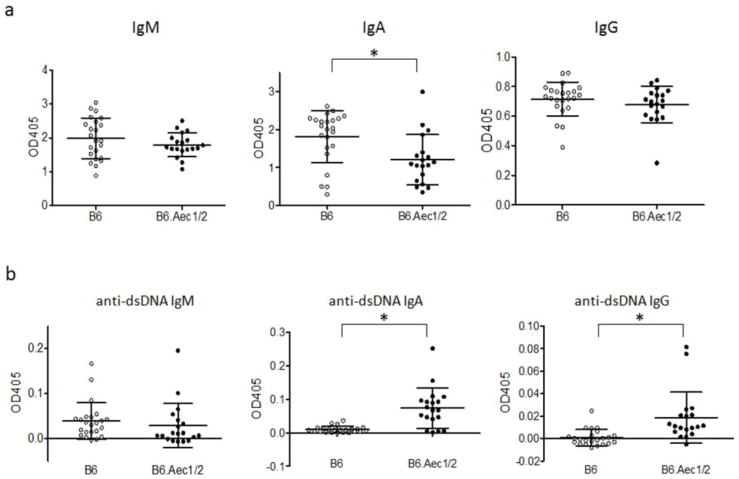
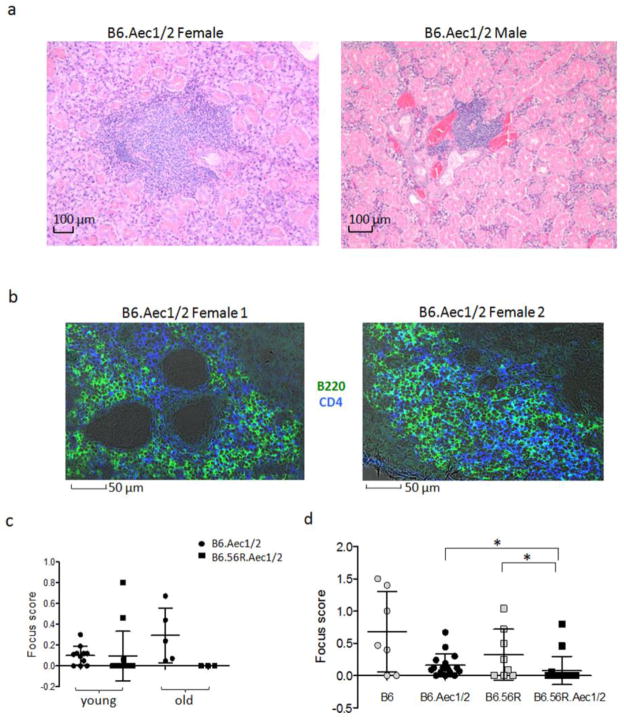
Purpose: Primary Sjögren's syndrome (SjS) is an autoimmune disorder characterized by lymphocytic infiltration of the salivary and lacrimal glands, B-cell clonal expansions and an increased risk of lymphoma. In order to understand the role of B cells in this disorder, the antibody repertoire and B-cell maturation were studied in a mouse model of SjS called B6.Aec1/2.
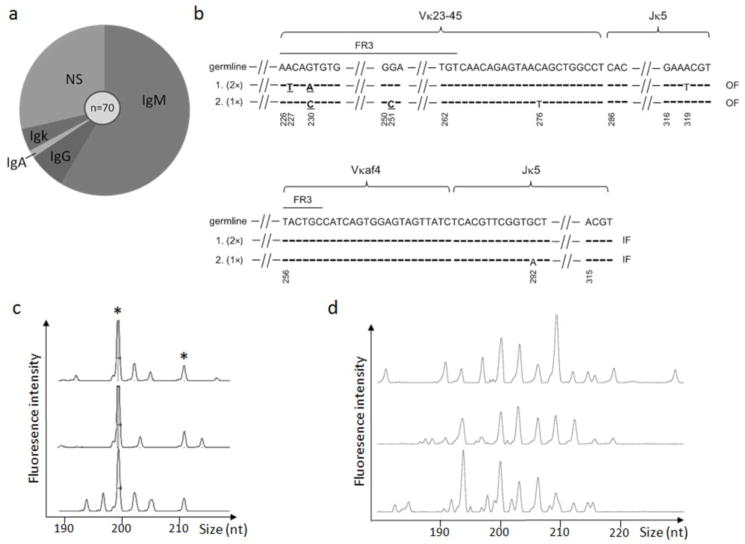
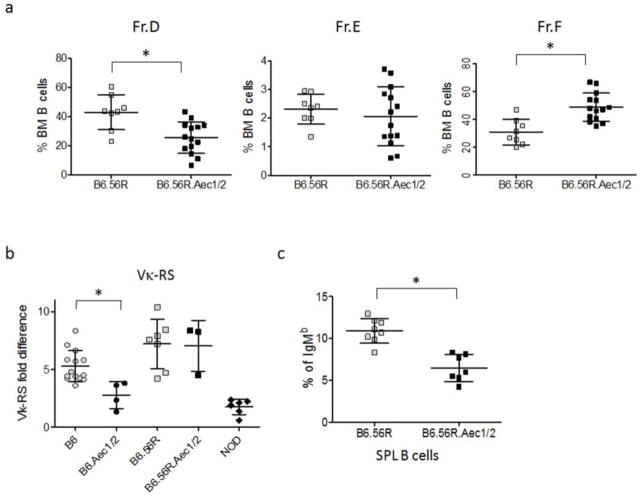
Methods: B6.Aec1/2 serum was analyzed for antibodies by ELISA and immunoprecipitation, B-cell development by flow cytometry, and antibody gene rearrangements by CDR3 spectratyping and quantitative PCR. In order to test the functional consequences of the observed defects, B6.Aec1/2 mice were crossed with anti-dsDNA antibody heavy chain knock-in mice (B6.56R).
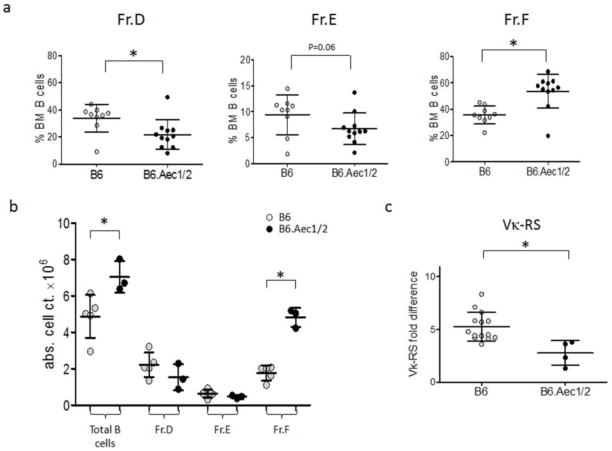
Results: B6.Aec1/2 mice exhibit B-cell clonal expansions, have altered serum immunoglobulin levels and spontaneously produce multireactive autoantibodies. B6.Aec1/2 mice also have decreased numbers of bone marrow pre-B cells and decreased frequencies of kappa light chain gene deletion. These findings suggest that B6.Aec1/2 mice have a defective early B-cell tolerance checkpoint. B6.56R.Aec1/2 mice unexpectedly had lower anti-dsDNA antibody levels than B6.56R mice and less salivary gland infiltration than B6.Aec1/2 mice.
Conclusions: These data suggest that the early tolerance checkpoint defect in B6.Aec1/2 mice is not sufficient to promulgate disease in mice with pre-formed autoantibodies, such as B6.56R. Rather, B6.Aec1/2 mice may require a diverse B-cell repertoire for efficient T-B-cell collaboration and disease propagation. These findings imply that therapies aimed at reducing B-cell diversity or T-B interactions may be helpful in treating SjS.
Figures
Similar articles
-
Analysis of IgM antibody production and repertoire in a mouse model of Sjögren's syndrome.J Leukoc Biol. 2016 Feb;99(2):321-31. doi: 10.1189/jlb.2A0715-297R. Epub 2015 Sep 17. J Leukoc Biol. 2016. PMID: 26382297 Free PMC article.
-
Time course of cytokine upregulation in the lacrimal gland and presence of autoantibodies in a predisposed mouse model of Sjögren's Syndrome: the influence of sex hormones and genetic background.Exp Eye Res. 2014 Nov;128:15-22. doi: 10.1016/j.exer.2014.09.001. Epub 2014 Sep 11. Exp Eye Res. 2014. PMID: 25218176 Free PMC article.
-
Ly9 (CD229) Antibody Targeting Depletes Marginal Zone and Germinal Center B Cells in Lymphoid Tissues and Reduces Salivary Gland Inflammation in a Mouse Model of Sjögren's Syndrome.Front Immunol. 2018 Nov 16;9:2661. doi: 10.3389/fimmu.2018.02661. eCollection 2018. Front Immunol. 2018. PMID: 30519241 Free PMC article.
-
Sjögren's syndrome (SjS)-like disease of mice: the importance of B lymphocytes and autoantibodies.Front Biosci. 2007 Jan 1;12:1767-89. doi: 10.2741/2187. Front Biosci. 2007. PMID: 17127420 Review.
-
New concepts for the development of autoimmune exocrinopathy derived from studies with the NOD mouse model.Arch Oral Biol. 1999 May;44 Suppl 1:S21-5. doi: 10.1016/s0003-9969(99)00045-x. Arch Oral Biol. 1999. PMID: 10414851 Review.
Cited by
-
The Pathophysiology of Dry Eye Disease: What We Know and Future Directions for Research.Ophthalmology. 2017 Nov;124(11S):S4-S13. doi: 10.1016/j.ophtha.2017.07.010. Ophthalmology. 2017. PMID: 29055361 Free PMC article. Review.
-
Immune Repertoires in Various Dermatologic and Autoimmune Diseases.Genes (Basel). 2024 Dec 11;15(12):1591. doi: 10.3390/genes15121591. Genes (Basel). 2024. PMID: 39766858 Free PMC article. Review.
-
Differentially Expressed Gene Pathways in the Conjunctiva of Sjögren Syndrome Keratoconjunctivitis Sicca.Front Immunol. 2021 Jul 19;12:702755. doi: 10.3389/fimmu.2021.702755. eCollection 2021. Front Immunol. 2021. PMID: 34349764 Free PMC article.
-
The T cell in Sjogren's syndrome: force majeure, not spectateur.J Autoimmun. 2012 Sep;39(3):229-33. doi: 10.1016/j.jaut.2012.05.019. Epub 2012 Jun 17. J Autoimmun. 2012. PMID: 22709856 Free PMC article. Review.
-
Mechanisms of central tolerance for B cells.Nat Rev Immunol. 2017 May;17(5):281-294. doi: 10.1038/nri.2017.19. Epub 2017 Apr 3. Nat Rev Immunol. 2017. PMID: 28368006 Free PMC article. Review.
References
-
- Tan EM. Autoantibodies to nuclear antigens (ANA): their immunobiology and medicine. Adv Immunol. 1982;33:167–240. - PubMed
-
- Franceschini F, Cavazzana I. Anti-Ro/SSA and La/SSB antibodies. Autoimmunity. 2005;38(1):55–63. - PubMed
-
- Cha S, Singson E, Cornelius J, Yagna JP, Knot HJ, Peck AB. Muscarinic acetylcholine type-3 receptor desensitization due to chronic exposure to Sjogren’s syndrome-associated autoantibodies. J Rheumatol. 2006;33(2):296–306. - PubMed
-
- Gao J, Cha S, Jonsson R, Opalko J, Peck AB. Detection of anti-type 3 muscarinic acetylcholine receptor autoantibodies in the sera of Sjogren’s syndrome patients by use of a transfected cell line assay. Arthritis Rheum. 2004;50(8):2615–21. - PubMed
-
- Peen E, Mellbye OJ, Haga HJ. IgA rheumatoid factor in primary Sjogren’s syndrome. Scand J Rheumatol. 2009;38(1):46–9. - PubMed
Publication types
MeSH terms
Substances
Grants and funding
LinkOut - more resources
Full Text Sources
Medical
