. 2012 Apr 1;72(7):1728-39.
doi: 10.1158/0008-5472.CAN-11-2762. Epub 2012 Feb 20.

RORα suppresses breast tumor invasion by inducing SEMA3F expression

Affiliations

RORα suppresses breast tumor invasion by inducing SEMA3F expression

Gaofeng Xiong et al. Cancer Res. .

Abstract

Inactivation of tumor suppressors and inhibitory microenvironmental factors is necessary for breast cancer invasion; therefore, identifying those suppressors and factors is crucial not only to advancing our knowledge of breast cancer, but also to discovering potential therapeutic targets. By analyzing gene expression profiles of polarized and disorganized human mammary epithelial cells in a physiologically relevant three-dimensional (3D) culture system, we identified retinoid orphan nuclear receptor alpha (RORα) as a transcription regulator of semaphorin 3F (SEMA3F), a suppressive microenvironmental factor. We showed that expression of RORα was downregulated in human breast cancer tissue and cell lines, and that reduced mRNA levels of RORα and SEMA3F correlated with poor prognosis. Restoring RORα expression reprogrammed breast cancer cells to form noninvasiveness structures in 3D culture and inhibited tumor growth in nude mice, accompanied by enhanced SEMA3F expression. Inactivation of RORα in nonmalignant human mammary epithelial cells inhibited SEMA3F transcription and impaired polarized acinar morphogenesis. Using chromatin immunoprecipitation and luciferase reporter assays, we showed that transcription of SEMA3F is directly regulated by RORα. Knockdown of SEMA3F in RORα-expressing cancer cells rescued the aggressive 3D phenotypes and tumor invasion. These findings indicate that RORα is a potential tumor suppressor and inhibits tumor invasion by inducing suppressive cell microenvironment.


Figures

Fig 1
Fig 1
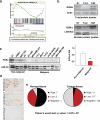
Expression of RORα is down-regulated in breast cancer. (a) GSEA analysis identified RORα as a potential regulator of the genes whose expression are significantly up-regulated in polarized S1 and reverted T4-2 cells compared to disorganized T4-2 cells. (b) Total and nuclear protein levels of RORα were examined by immunoblotting in T4-2 cells, S1 and reverted T4-2 (T4R) cells. RORα level was down-regulated in disorganized T4-2 cells compared with polarized S1 cells and reverted T4-2 cells. (c) RORα expression was examined by immunoblotting in malignant (8) and nonmalignant (4) HMECs cultured in 3D Matrigel. RORα expression in malignant human breast cancer cells was significantly reduced compared to non-malignant human HMECs. The immunoblotting results were quantified by AlphaInnotech HD software. (d) Immunohistochemistry analysis of RORα expression in normal and malignant human breast tissue. Bar: 40 μm. (e) The pie graph showed staining intensity of RORα in normal breast tissue (n=13) and breast cancer tissue (n=260). The staining intensity was graded to three different levels. Most of normal breast tissue presented positive signal of RORα in nuclear of epithelial cells. In breast cancer tissue, most breast cancer tissue displayed weak positive signal of RORα (Low) and negative signal (Negative). Fisher's exact test showed that RORα protein level was significantly downregulated in breast cancer tissue compared to normal tissue.
Fig 2
Fig 2
Restoring RORα expression in malignant T4-2 cells suppressed the aggressive phenotypes in 3D culture and inhibited tumor growth in vivo. (a) RORα expression in infected cells was verified by western blot. (b) Phase and immunofluorescence images of RORα1-expressing and control T4-2 cells in 3D culture. RORα-expressing T4-2 cells formed polarized spheroids, whereas control T4-2 cells still maintained disorganized grape-like structures. Bar, 40μm. (c) Bar graph showing the ratio of polarized colony of the control and RORα-expressing T4-2 cells in 3D culture, n=3. (d) Ki67 staining analyzing proliferation of control and RORα1 expression T4-2 cells in 3D culture. RORα1 and RORα4 both inhibited proliferation of T4-2 cell. (e) Activation of Akt and MEK were assessed by western blot. Levels of phosphorylated Akt and MEK were both reduced in RORα-expressing T4-2 cells. (f) Transwell assay analyzing the invasion activities of control and RORα-expressing T4-2 cells, n=4. RORα expression significantly reduced cells invasion. (g) Growth Curve of tumors formed by RORα1-expressing and control T4-2 in nude mice, n=5. (h) Weight of tumors formed by RORα1- expressing and control T4-2 cells, n=5. (i) Ki67 IHC analysis of cell proliferation in tumor tissue. Cell proliferation in control tumor was much higher than that in RORα-expressing tumor. Bar: 20μm. * p<0.05, ** p<0.01.
Fig 3
Fig 3
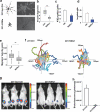
RORα inhibited invasion and migration of MDA-MB-231 cells. (a) Phase images of MDA-MB-231 cells in 3D culture. Bar: 40 μm. (b) Bar graph of the invaded branches in MDA-MB-231 cells in 3D culture, n=22. (c) Ki67 staining analysis of cell proliferation in MDA-MB-231 cells. Proliferation of RORα1-expressing MDA-MB-231 cells was significantly inhibited compared with control cells. (d) Invasion analysis of control and RORα1-expressing MDA-MB-231 cells. RORα expression significantly inhibited cell invasion in MDA-MB 231 cells compared, n=4. (e) Single cell migration analysis of MDA-MB 231 cells. Migration of the RORα1-expressing cells was significantly reduced compared to the control cells, n=72. (f) The paths of cell migration in control and RORα-expressing MDA-MB 231 cells, n=25. (g) Growth of tumors formed by RORα1-expressing and control MDA-MB 231/Luc cells in SCID mice was imaged by IVIS (n=6). (h) Bar graph showing that tumor volume formed by RORα1-expressing cells was significantly reduced compared with control MDA-MB 231/Luc cells. * p<0.05, ** p<0.01.
Fig 4
Fig 4
Silencing RORα expression in nonmalignant S1 cells disrupts polarized acinar structures. (a) Immunoblotting analysis of knockdown efficiency of shRNA in S1 cells. (b) Phase and immunofluorescence images of S1 cells in 3D culture. Staining with α6 integrin antibody showed that RORα knockdown S1 cells formed disorganized structures in 3D culture. (c) Quantification of colony size of control and RORα knockdown S1 cells in 3D culture by measuring the diameter of 50 colonies. Knockdown RORα in S1 cells slightly increased the colony size. (d) Bar graph quantifying the ratio of polarized colonies of control cells and RORα knockdown S1 cells in 3D culture, n=3. Bar: 40μm. * p<0.05, ** p<0.01.
Fig 5
Fig 5
SEMA3F is a RORα target gene mediating its tumor suppressor function. (a, b) SEMA3F secretion was assessed by western blot in the conditional medium of S1, T4-2, reverted T4-2 cells (T4R), and RORα-expressing T4-2 cells. Conditional medium isolated from same amount of cells was loaded, and SEMA3F levels were elevated in the medium of S1, reverted T4-2, and RORα-expressing T4-2 cells. (c) Quantitative RT-PCR measuring SEMA3F mRNA level in T4-2, reverted T4-2, and RORα-expressing T4-2 cells (n=4). (d) Quantitative RT-PCR measuring SEMA3F mRNA level in S1 and RORα knockdown S1 cells (n=6). (e) ChIP analyzing protein enrichment in the SEMA3F promoter region in control and RORα-expressing T4-2 cells. Binding of RORα protein but not histone H3 to SEMA3F promoter was significantly enhanced in RORα-expressing T4-2 cells, n=3. (f) Luciferase assay measuring the transcriptional activity of SEMA3F promoter (from residues −1513 to −1240) in response to RORα expression. RORα1 enhanced promoter activity of SEMA3F in a dose-dependent manner, n=4. (g) A deletion of RORE in SEMA3F promoter (from residues −1372 to −1360) was made and cloned into pGL4 vector. Promoter activity of SEMA3F in response to RORα was reduced by deletion of the RORE, n=4. * p<0.05, ** p<0.01.
Fig 6
Fig 6
Silencing SEMA3F partially rescues the malignant phenotypes suppressed by RORα. (a) Western blot results showed that SEMA3F protein level was reduced in si-SEMA3F transfected RORα-expressing breast cancer cells. (b) Phase images of control and SEMA3F-silenced RORα-expressing MDA-MB 231 cells in 3D culture. Silencing SEMA3F in RORα-expressing MDA-MB 231 cells rescued invasive phenotype of MDA-MB 231 cells in 3D culture. (c) Quantifying the invasive branches in siRNA control and SEMA3F-silenced RORα-expressing MDA-MB 231 cells. Over 40 colonies were counted, and the experiments were repeated three times. (d) Transwell assay showed that reducing SEMA3F expression in RORα-expressing T4-2 and MDA-MB 231 cells rescued the cell invasion, n=4. (e) Activation of Akt and MEK were assessed in the control and SEMA3F-silenced RORα-expressing MDA-MB 231 cells. Knockdown of SEMA3F enhanced phosphorylation of MEK. (f) Bar graph showing that silencing SEMA3F had little effects on tumor growth in RORα1-expressing MDA-MB 231/Luc cells. (g) Hematoxylin and eosin (H&E) staining of tumors formed by SEME3F knockdown and control RORα1-expressing MDA-MB 231/Luc cells. Bar: 20μm; * p<0.05, ** p<0.01.
Fig 7
Fig 7
Repression of RORα-SEMA3F pathway is associated with poor prognosis in breast cancer patients. (a) IHC analysis of RORα and SEMA3F expression in human breast cancer tissue array. Bar: 20μm. (b) Bar graph showing that the distribution of double positive or negative staining of RORα and SEMA3F in grad I, II and III breast tumor tissues. The Fisher's exact test showed that inactivation of RORα and SEMA3F is associated with high tumor grading (see Supplemental Table 2). (c, d) Kaplan Meier survival analysis of breast cancer patients grouped by expression levels of RORα (c) and SEMA3F (d). The tumor samples were classified into low (RORα, n=114; SEMA3F, n=131), high (RORα, n=121; SEMA3F, n=124), and moderate (RORα, n=169; SEMA3F, n=149) based on the mRNA levels of RORα or SEMA3F in the published microarray datasets. Significant differences in survival time were calculated using the Cox proportional hazard (log-rank) test.

Similar articles

Cited by

References

    1. Jetten AM. Retinoid-related orphan receptors (RORs): critical roles in development, immunity, circadian rhythm, and cellular metabolism. Nucl Recept Signal. 2009;7:e003. - PMC - PubMed
    1. Jetten AM, Kurebayashi S, Ueda E. The ROR nuclear orphan receptor subfamily: critical regulators of multiple biological processes. Prog Nucleic Acid Res Mol Biol. 2001;69:205–47. - PubMed
    1. Carlberg C, Hooft van Huijsduijnen R, Staple JK, DeLamarter JF, Becker-Andre M. RZRs, a new family of retinoid-related orphan receptors that function as both monomers and homodimers. Mol Endocrinol. 1994;8:757–70. - PubMed
    1. Dussault I, Fawcett D, Matthyssen A, Bader JA, Giguere V. Orphan nuclear receptor ROR alpha-deficient mice display the cerebellar defects of staggerer. Mech Dev. 1998;70:147–53. - PubMed
    1. Matysiak-Scholze U, Nehls M. The structural integrity of ROR alpha isoforms is mutated in staggerer mice: cerebellar coexpression of ROR alpha1 and ROR alpha4. Genomics. 1997;43:78–84. - PubMed

Publication types

MeSH terms

Substances