

Regional variation in late preterm births in North Carolina
- PMID: 22350629
- PMCID: PMC3725330
- DOI: 10.1007/s10995-012-0945-7
Regional variation in late preterm births in North Carolina
Abstract
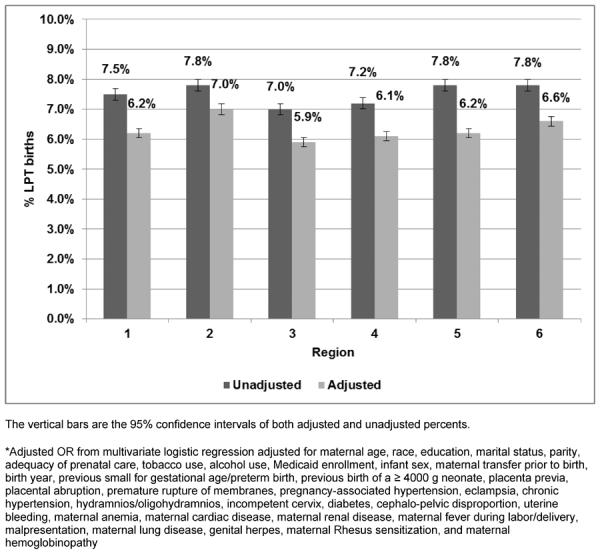
Late preterm (LPT) neonates (34 0/7th-36 6/7th weeks' gestation) account for 70% of all premature births in the United States. LPT neonates have a higher morbidity and mortality risk than term neonates. LPT birth rates vary across geographic regions. Unwarranted variation is variation in medical care that cannot be explained by sociodemographic or medical risk factors; it represents differences in health system performance, including provider practice variation. The purpose of this study is to identify regional variation in LPT births in North Carolina that cannot be explained by sociodemographic or medical/obstetric risk factors. We searched the NC State Center for Health Statistics linked birth-death certificate database for all singleton term and LPT neonates born between 1999 and 2006. We used multivariable logistic regression analysis to control for socio-demographic and medical/obstetric risk factors. The main outcome was the percent of LPT birth in each of the six perinatal regions in North Carolina. We identified 884,304 neonates; 66,218 (7.5%) were LPT. After multivariable logistic regression, regions 2 (7.0%) and 6 (6.6%) had the highest adjusted percent of LPT birth. Analysis of a statewide birth cohort demonstrates regional variation in the incidence of LPT births among NC's perinatal regions after adjustment for sociodemographic and medical risk factors. We speculate that provider practice variation might explain some of the remaining difference. This is an area where policy changes and quality improvement efforts can help reduce variation, and potentially decrease LPT births.
Figures

Similar articles
-
Avoiding late preterm deliveries to reduce neonatal complications: an 11-year cohort study.BMC Pregnancy Childbirth. 2018 Jan 8;18(1):17. doi: 10.1186/s12884-017-1650-8. BMC Pregnancy Childbirth. 2018. PMID: 29310615 Free PMC article.
-
Practice variation in late-preterm deliveries: a physician survey.J Perinatol. 2013 May;33(5):347-51. doi: 10.1038/jp.2012.119. Epub 2012 Sep 27. J Perinatol. 2013. PMID: 23018796 Free PMC article.
-
Does antenatal steroids treatment in twin pregnancies prior to late preterm birth reduce neonatal morbidity? Evidence from a retrospective cohort study.Arch Gynecol Obstet. 2020 Nov;302(5):1121-1126. doi: 10.1007/s00404-020-05709-w. Epub 2020 Jul 29. Arch Gynecol Obstet. 2020. PMID: 32728923
-
Quality initiatives related to moderately preterm, late preterm, and early term births.Clin Perinatol. 2013 Dec;40(4):777-89. doi: 10.1016/j.clp.2013.07.011. Epub 2013 Sep 20. Clin Perinatol. 2013. PMID: 24182961 Review.
-
Cross-Country Individual Participant Analysis of 4.1 Million Singleton Births in 5 Countries with Very High Human Development Index Confirms Known Associations but Provides No Biologic Explanation for 2/3 of All Preterm Births.PLoS One. 2016 Sep 13;11(9):e0162506. doi: 10.1371/journal.pone.0162506. eCollection 2016. PLoS One. 2016. PMID: 27622562 Free PMC article. Review.
Cited by
-
Center Variation in the Delivery of Indicated Late Preterm Births.Am J Perinatol. 2016 Aug;33(10):1008-16. doi: 10.1055/s-0036-1582129. Epub 2016 Apr 27. Am J Perinatol. 2016. PMID: 27120474 Free PMC article.
-
Identification and classification of principal features for analyzing unwarranted clinical variation.J Eval Clin Pract. 2024 Mar;30(2):251-259. doi: 10.1111/jep.13940. Epub 2023 Nov 7. J Eval Clin Pract. 2024. PMID: 37933789 Free PMC article. Review.
-
Regional Variation in Antenatal Late Preterm Steroid Use Following the ALPS Trial.JAMA Netw Open. 2024 Jan 2;7(1):e2350830. doi: 10.1001/jamanetworkopen.2023.50830. JAMA Netw Open. 2024. PMID: 38194234 Free PMC article.
References
-
- Martin JA, Hamilton BE, Sutton PD, et al. Births: final data for 2007. Natl Vital Stat Rep. 2010;58(24):1–85. - PubMed
-
- Raju TN, Higgins RD, Stark AR, et al. Optimizing care and outcome for late-preterm (near-term) infants: a summary of the workshop sponsored by the National Institute of Child Health and Human Development. Pediatrics. 2006;118(3):1207–14. - PubMed
-
- Martin JA, Hamilton BE, Sutton PD, et al. Births: Final Data for 2006. National Center for Health Statistics; Hyattsville, MD: 2009. Contract No.: 7. - PubMed
-
- Engle WA, Tomashek KM, Wallman C. “Late-preterm” infants: a population at risk. Pediatrics. 2007;120(6):1390–401. - PubMed
-
- Morse SB, Zheng H, Tang Y, et al. Early school-age outcomes of late preterm infants. Pediatrics. 2009;123(4):e622–9. - PubMed
Publication types
MeSH terms
Grants and funding
LinkOut - more resources
Full Text Sources
Medical
