

A muscle's force depends on the recruitment patterns of its fibers
- PMID: 22350666
- PMCID: PMC3386380
- DOI: 10.1007/s10439-012-0531-6
A muscle's force depends on the recruitment patterns of its fibers
Abstract
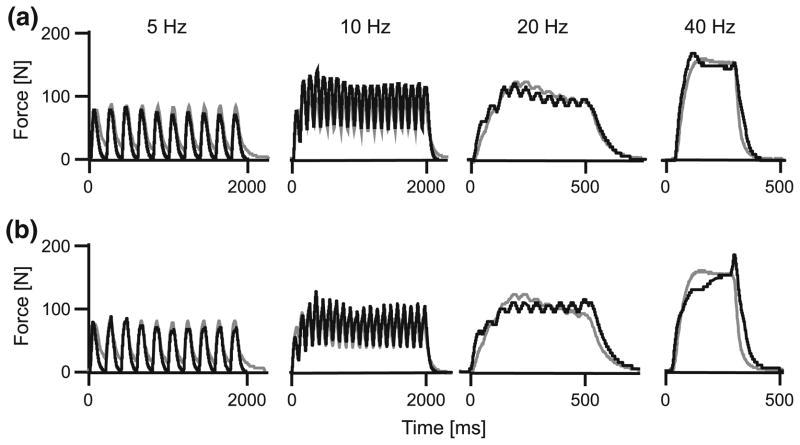
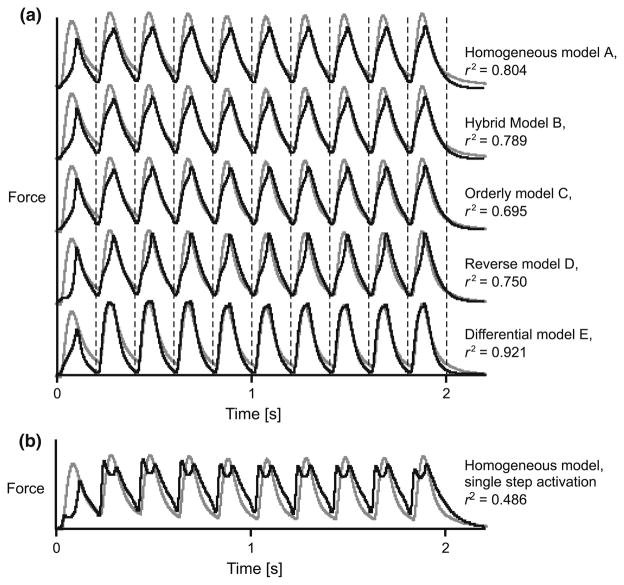
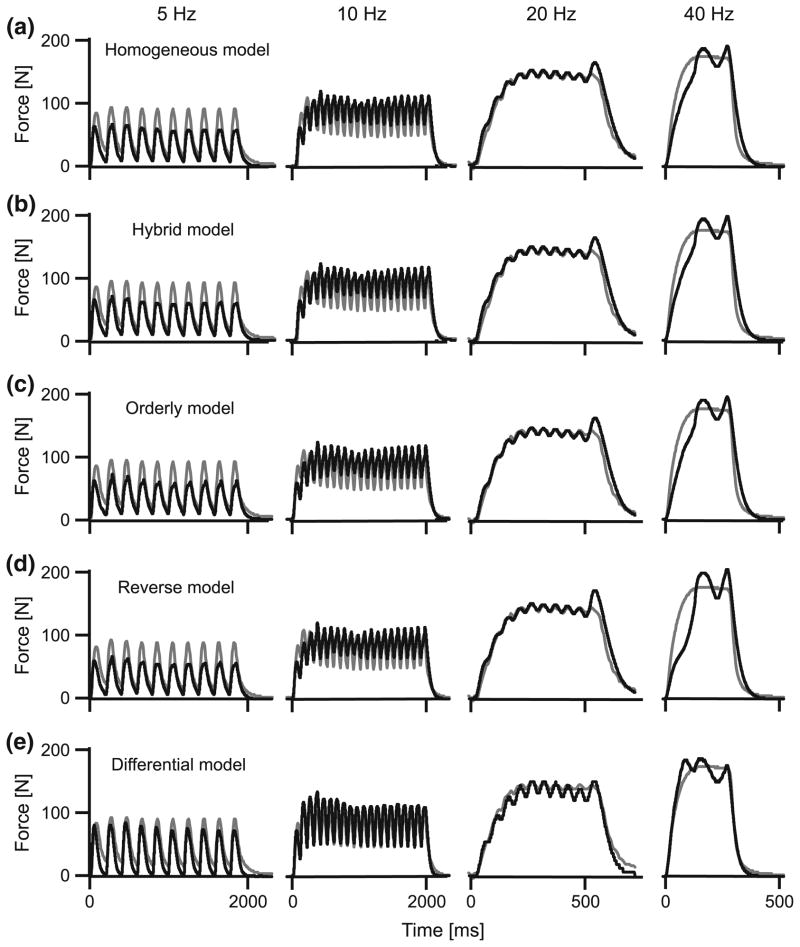
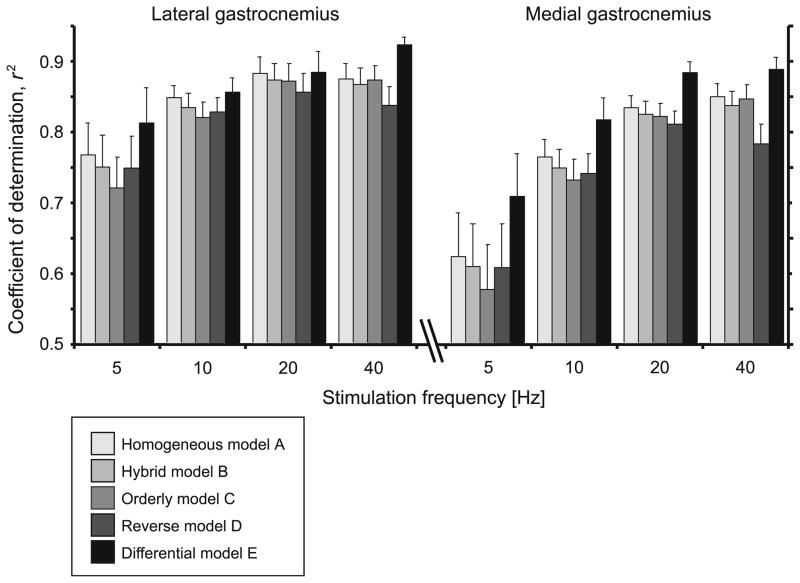
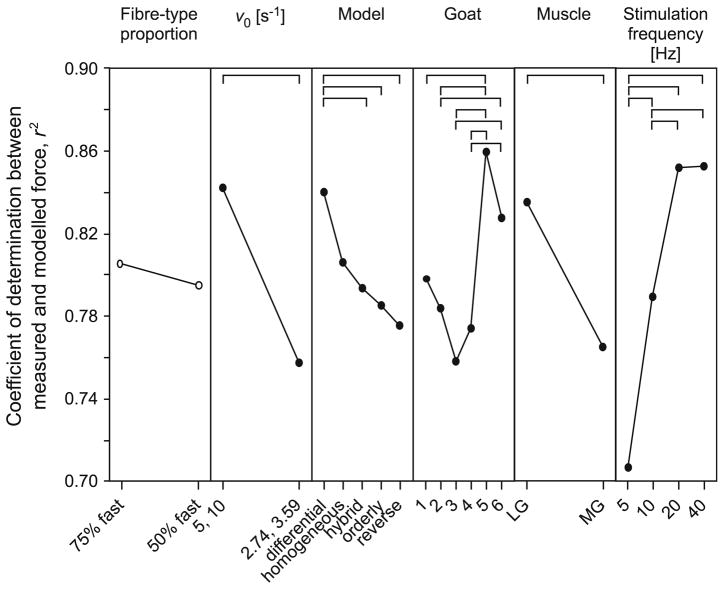
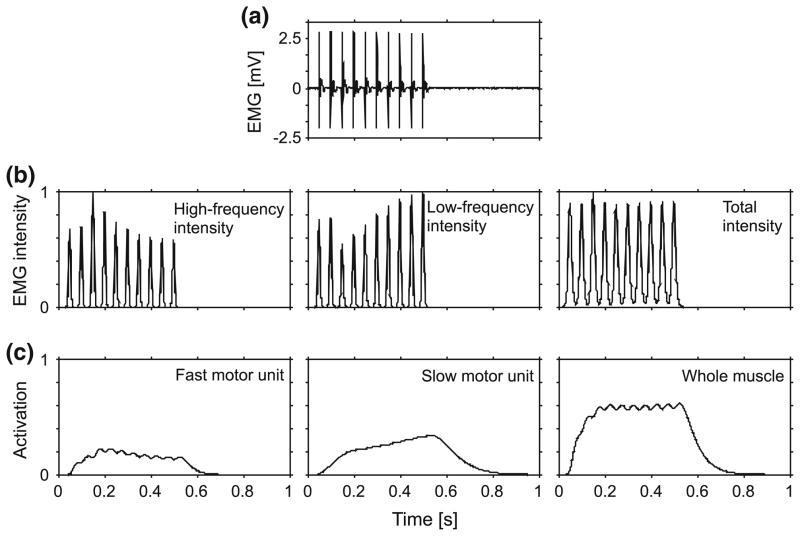
Biomechanical models of whole muscles commonly used in simulations of musculoskeletal function and movement typically assume that the muscle generates force as a scaled-up muscle fiber. However, muscles are comprised of motor units that have different intrinsic properties and that can be activated at different times. This study tested whether a muscle model comprised of motor units that could be independently activated resulted in more accurate predictions of force than traditional Hill-type models. Forces predicted by the models were evaluated by direct comparison with the muscle forces measured in situ from the gastrocnemii in goats. The muscle was stimulated tetanically at a range of frequencies, muscle fiber strains were measured using sonomicrometry, and the activation patterns of the different types of motor unit were calculated from electromyographic recordings. Activation patterns were input into five different muscle models. Four models were traditional Hill-type models with different intrinsic speeds and fiber-type properties. The fifth model incorporated differential groups of fast and slow motor units. For all goats, muscles and stimulation frequencies the differential model resulted in the best predictions of muscle force. The in situ muscle output was shown to depend on the recruitment of different motor units within the muscle.
Figures
Similar articles
-
Validation of Hill-type muscle models in relation to neuromuscular recruitment and force-velocity properties: predicting patterns of in vivo muscle force.Integr Comp Biol. 2014 Dec;54(6):1072-83. doi: 10.1093/icb/icu070. Epub 2014 Jun 12. Integr Comp Biol. 2014. PMID: 24928073 Free PMC article. Review.
-
Accuracy of gastrocnemius muscles forces in walking and running goats predicted by one-element and two-element Hill-type models.J Biomech. 2013 Sep 3;46(13):2288-95. doi: 10.1016/j.jbiomech.2013.06.001. Epub 2013 Jul 18. J Biomech. 2013. PMID: 23871235 Free PMC article.
-
Recruitment of faster motor units is associated with greater rates of fascicle strain and rapid changes in muscle force during locomotion.J Exp Biol. 2013 Jan 15;216(Pt 2):198-207. doi: 10.1242/jeb.072637. Epub 2012 Sep 12. J Exp Biol. 2013. PMID: 22972893 Free PMC article.
-
Comparison of human gastrocnemius forces predicted by Hill-type muscle models and estimated from ultrasound images.J Exp Biol. 2017 May 1;220(Pt 9):1643-1653. doi: 10.1242/jeb.154807. Epub 2017 Feb 15. J Exp Biol. 2017. PMID: 28202584 Free PMC article.
-
Morphology and physiology of masticatory muscle motor units.Crit Rev Oral Biol Med. 2001;12(1):76-91. doi: 10.1177/10454411010120010601. Crit Rev Oral Biol Med. 2001. PMID: 11349964 Review.
Cited by
-
A prolonged hiatus in postmenopausal HRT, does not nullify the therapy's positive impact on ageing related sarcopenia.PLoS One. 2021 May 5;16(5):e0250813. doi: 10.1371/journal.pone.0250813. eCollection 2021. PLoS One. 2021. PMID: 33951065 Free PMC article.
-
Task-dependent recruitment across ankle extensor muscles and between mechanical demands is driven by the metabolic cost of muscle contraction.J R Soc Interface. 2021 Jan;18(174):20200765. doi: 10.1098/rsif.2020.0765. Epub 2021 Jan 6. J R Soc Interface. 2021. PMID: 33402020 Free PMC article.
-
Effect of Parkinson's disease and two therapeutic interventions on muscle activity during walking: a systematic review.NPJ Parkinsons Dis. 2020 Sep 9;6:22. doi: 10.1038/s41531-020-00119-w. eCollection 2020. NPJ Parkinsons Dis. 2020. PMID: 32964107 Free PMC article. Review.
-
The Maximal Lactate Steady State Workload Determines Individual Swimming Performance.Front Physiol. 2021 Apr 26;12:668123. doi: 10.3389/fphys.2021.668123. eCollection 2021. Front Physiol. 2021. PMID: 33981254 Free PMC article.
-
Neurophysiological Characterization of a Non-Human Primate Model of Traumatic Spinal Cord Injury Utilizing Fine-Wire EMG Electrodes.Sensors (Basel). 2019 Jul 27;19(15):3303. doi: 10.3390/s19153303. Sensors (Basel). 2019. PMID: 31357572 Free PMC article.
References
-
- Ariano MA, Armstrong RB, Edgerton VR. Hindlimb muscle fiber populations of five mammals. J Histochem Cytochem. 1973;21:51–55. - PubMed
-
- Askew GN, Marsh RL. The effects of length trajectory on the mechanical power output of mouse skeletal muscles. J Exp Biol. 1997;200:3119–3131. - PubMed
-
- Askew GN, Marsh RL. Optimal shortening velocity (V/Vmax) of skeletal muscle during cyclical contractions: length–force effects and velocity-dependent activation and deactivation. J Exp Biol. 1998;201:1527–1540. - PubMed
-
- Biewener AA, Daley MA. Muscle force–length dynamics during level versus incline locomotion: a comparison of in vivo performance of two guinea fowl ankle extensors. J Exp Biol. 2003;296:2941–2958. - PubMed
Publication types
MeSH terms
Grants and funding
LinkOut - more resources
Full Text Sources
Other Literature Sources
