

Nardilysin and ADAM proteases promote gastric cancer cell growth by activating intrinsic cytokine signalling via enhanced ectodomain shedding of TNF-α
- PMID: 22351606
- PMCID: PMC3403297
- DOI: 10.1002/emmm.201200216
Nardilysin and ADAM proteases promote gastric cancer cell growth by activating intrinsic cytokine signalling via enhanced ectodomain shedding of TNF-α
Abstract
Nardilysin (NRDc), a metalloendopeptidase of the M16 family, promotes ectodomain shedding of the precursor forms of various growth factors and cytokines by enhancing the protease activities of ADAM proteins. Here, we show the growth-promoting role of NRDc in gastric cancer cells. Analyses of clinical samples demonstrated that NRDc protein expression was frequently elevated both in the serum and cancer epithelium of gastric cancer patients. After NRDc knockdown, tumour cell growth was suppressed both in vitro and in xenograft experiments. In gastric cancer cells, NRDc promotes shedding of pro-tumour necrosis factor-alpha (pro-TNF-α), which stimulates expression of NF-κB-regulated multiple cytokines such as interleukin (IL)-6. In turn, IL-6 activates STAT3, leading to transcriptional upregulation of downstream growth-related genes. Gene silencing of ADAM17 or ADAM10, representative ADAM proteases, phenocopied the changes in cytokine expression and cell growth induced by NRDc knockdown. Our results demonstrate that gastric cancer cell growth is maintained by autonomous TNF-α-NF-κB and IL-6-STAT3 signalling, and that NRDc and ADAM proteases turn on these signalling cascades by stimulating ectodomain shedding of TNF-α.
Copyright © 2012 EMBO Molecular Medicine.
Figures
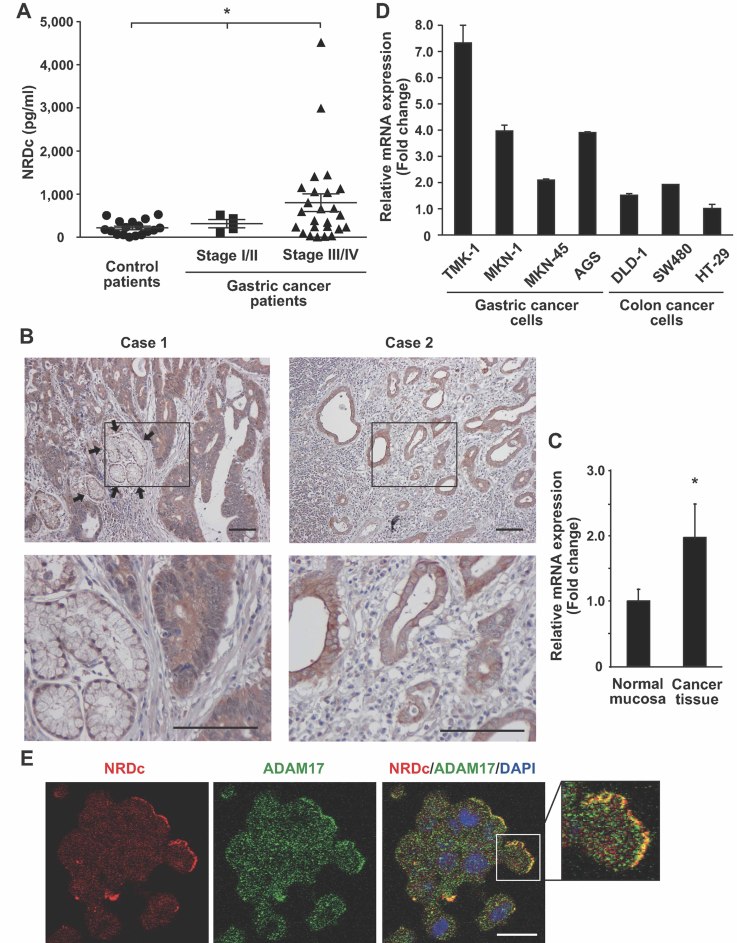
Serum NRDc concentration in the control (n = 17) or gastric cancer patients (stage I/II, n = 4; stage III/IV, n = 25) quantified by ELISA is plotted. *p < 0.05 by the non-parametric Kruskal–Wallis test.
NRDc expression in advanced gastric cancer tissues was examined by immunohistochemistry using surgically resected specimens. Microphotographs from two representative cases are shown. Arrows indicate the non-cancerous gastric foveolar epithelium. Lower panels are magnified images of the boxed areas in the upper panels. Scale bars, 100 µm.
Total RNA was extracted separately from resected gastric cancer tissue and adjacent non-cancerous mucosa (n = 28), and NRDc mRNA was quantified by RT-PCR. *p < 0.05 by paired Student's t-test.
NRDc mRNA expression in four gastric cancer cell lines (TMK-1, MKN-1, MKN-45 and AGS) and three colon cancer cell lines (DLD-1, SW480 and HT-29) was quantified by RT-PCR. Data are shown as mean ± SD of duplicate assays.
AGS cells were treated with 100 nM PMA at 37°C for 1 h, followed by staining with anti-NRDc and ADAM17 antibodies. Scale bar, 20 µm.
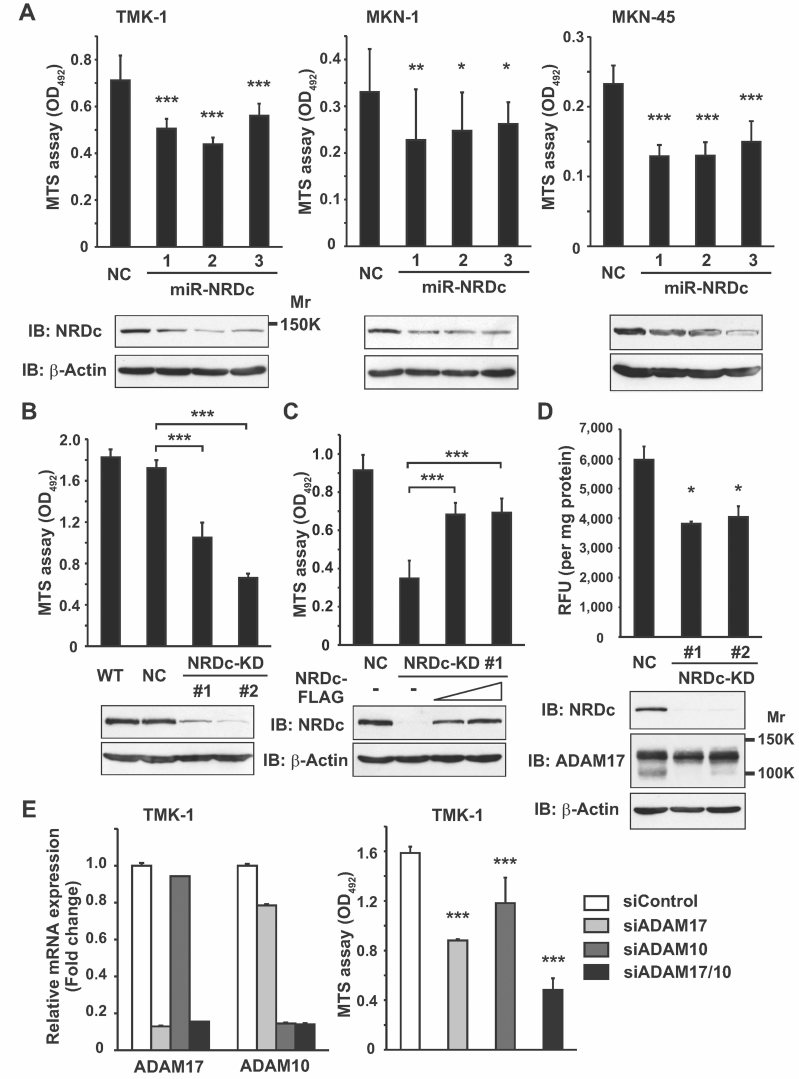
WT TMK-1, MKN-1 and MKN-45 cells were transiently transfected with the control or miR-NRDc plasmids. At 72 h after transfection, 1.5 or 3.0 × 10³ of the cells were seeded in 96-well plates and cultured in the growth medium for 48 h (TMK-1 and MKN-45) or 96 h (MKN-1). The number of viable cells was quantified using the MTS assay (upper panels). Knockdown effects were confirmed by Western blotting (lower panels).
The MTS assay was performed using the WT, negative control clone (NC), or stable KD TMK-1 clones (NRDc-KD #1 and #2).
The NRDc-KD #1 TMK-1 cells were transfected with the NRDc-FLAG-expressing plasmids at increasing doses. At 48 h after transfection, the MTS assay was performed in the same manner. Recovery of NRDc expression was confirmed by Western blotting (lower panels).
Cell lysates were prepared from the indicated clones without using protease inhibitors. TACE activity of each lysate is shown in the upper panel. Lower panels, ADAM17 protein expression was analysed by Western blotting.
Left panel, siRNA targeting ADAM17, ADAM10 or the combination was introduced into TMK-1 cells. At 72 h after transfection, qRT-PCR was performed. Right panel, after TMK-1 cells were incubated with the indicated siRNA duplex for 48 h, MTS assay was performed for the additional 48 h as described in Fig 2A.
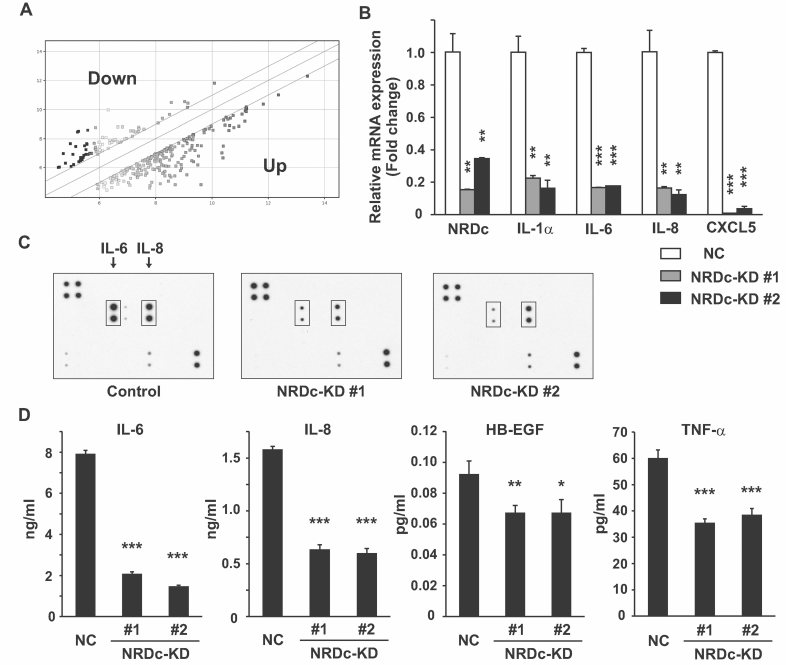
Gene expression analysis by microarray. Total RNA was extracted from the NC or NRDc-KD #1 TMK-1 cells and subjected to microarray analysis using the Affymetrix GeneChip Human Gene 1.0 ST Array. The scatter plot shows the genes upregulated (bottom right) or downregulated (top left) more than twofold in the NRDc-KD cells against the control cells.
Total RNA was extracted from the NC or NRDc-KD TMK-1 clones, and qRT-PCR was performed for the indicated genes.
Protein expression profile in CM from the control or stable NRDc-KD TMK-1 clones was screened using the antibody array. Positions of IL-6 and IL-8 are indicated.
Concentrations of the indicated proteins in CM from each stable clone were quantified by ELISA. Results are shown as mean ± SD of triplicate samples.
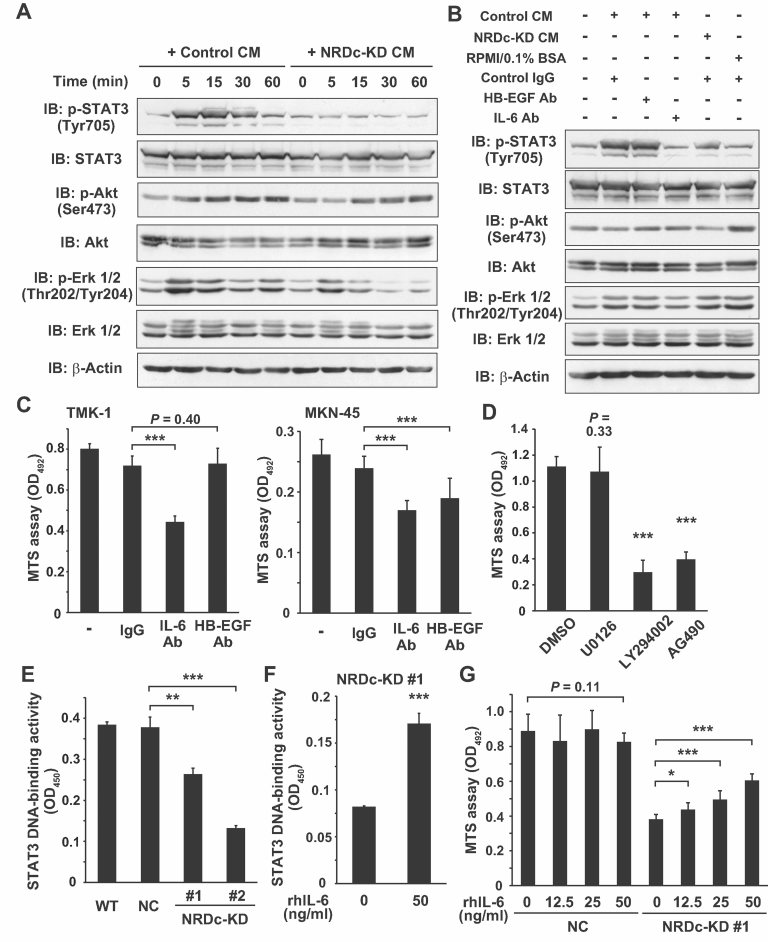
Confluent monolayers of WT TMK-1 cells were serum starved overnight and incubated with CM from the control NC TMK-1 (control CM) or NRDc-KD #1 cells (NRDc-KD CM) for the indicated time periods. Cell lysates were prepared and probed with the indicated antibodies.
Control CM, NRDc-KD CM or RPMI containing 0.1% bovine serum albumin (BSA) was incubated at 37°C for 1 h with 10 µg/ml HB-EGF neutralizing antibody, 2 µg/ml IL-6 neutralizing antibody, control isotype IgG or combinations of the antibodies (total amounts of IgG were adjusted to 10 µg/ml). Serum-starved TMK-1 cells were treated with preincubated CM for 10 min as indicated. Each cell lysate was probed with the indicated antibodies.
TMK-1 (left panel) or MKN-45 (right panel) cells were cultured in the growth medium containing 10 µg/ml HB-EGF neutralizing antibody, 2 µg/ml IL-6 neutralizing antibody or control isotype IgG for 24 h, and the MTS assay was performed.
TMK-1 cells were treated with 10 µM U0126, 50 µM LY294002, 50 µM AG490 or 0.05% DMSO (as a control) for 24 h, and the number of viable cells was quantified using the MTS assay.
Nuclear extracts were prepared from the indicated cells. DNA-binding activity of STAT3 to its consensus sequence was analysed using the TransAM DNA-binding ELISA kit. Results are shown as mean ± SD of triplicate assays.
The NRDc-KD #1 cells were incubated with vehicle (PBS containing 0.1% BSA) or 50 ng/ml recombinant human IL-6 protein for 1 h, followed by STAT3 DNA-binding ELISA.
The NC or stable NRDc-KD #1 TMK-1 cells were treated with the indicated concentrations of IL-6 protein or vehicle. The MTS assay was performed after incubation for 24 h.
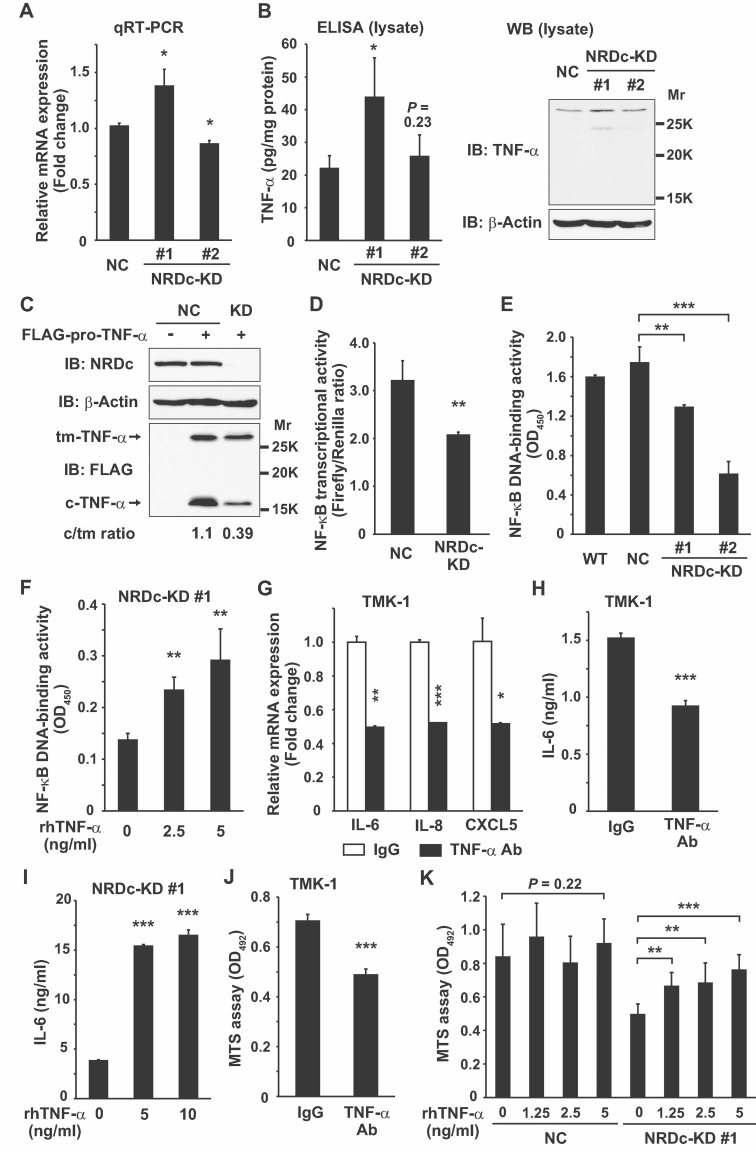
TNF-α mRNA level in the indicated stable cells was analysed by qRT-PCR.
Left panel, TNF-α protein expression in the cell lysates was quantified by ELISA. Right panels, same lysates were subjected to Western blotting using anti-TNF-α antibody recognizing the extracellular domain of TNF-α.
FLAG-pro-TNF-α (or equal amount of the empty vector) was expressed in the NC or NRDc-KD #1 TMK-1 cells as indicated. At 36 h after transfection, the cells were lysed and aliquots were probed with the indicated antibodies. tm-, transmembrane precursor; c-, N-terminal cytosolic remnant.
NF-κB transcriptional activity was analysed by luciferase assay in the NC or NRDc-KD #1 TMK-1 cells transfected with pNF-κB-Luc and pRL-TK reporter genes.
Nuclear extracts were prepared from the indicated cells, and DNA-binding activity of NF-κB p65 in each nuclear extract was measured.
The NRDc-KD #1 cells were stimulated with the increasing doses of recombinant TNF-α protein for 1 h. Then NF-κB DNA-binding activity was analysed.
TMK-1 cells were cultured in the presence of 2 µg/ml control IgG or anti-TNF-α neutralizing antibody for 24 h, and qRT-PCR was performed for the indicated genes.
IL-6 protein secretion into CM was quantified by ELISA after TMK-1 cells were treated with 2 µg/ml control IgG or anti-TNF-α neutralizing antibody for 48 h.
ELISA quantified the IL-6 concentration in CM from the NRDc-KD #1 cells incubated with the indicated concentrations of recombinant TNF-α for 48 h.
Cell viability was analysed with the MTS assay after TMK-1 cells were incubated with the indicated antibodies for 24 h.
The NC or NRDc-KD #1 TMK-1 cells seeded in 96-well plates were incubated with the increasing doses of TNF-α or vehicle for 24 h, followed by analysis using the MTS assay.
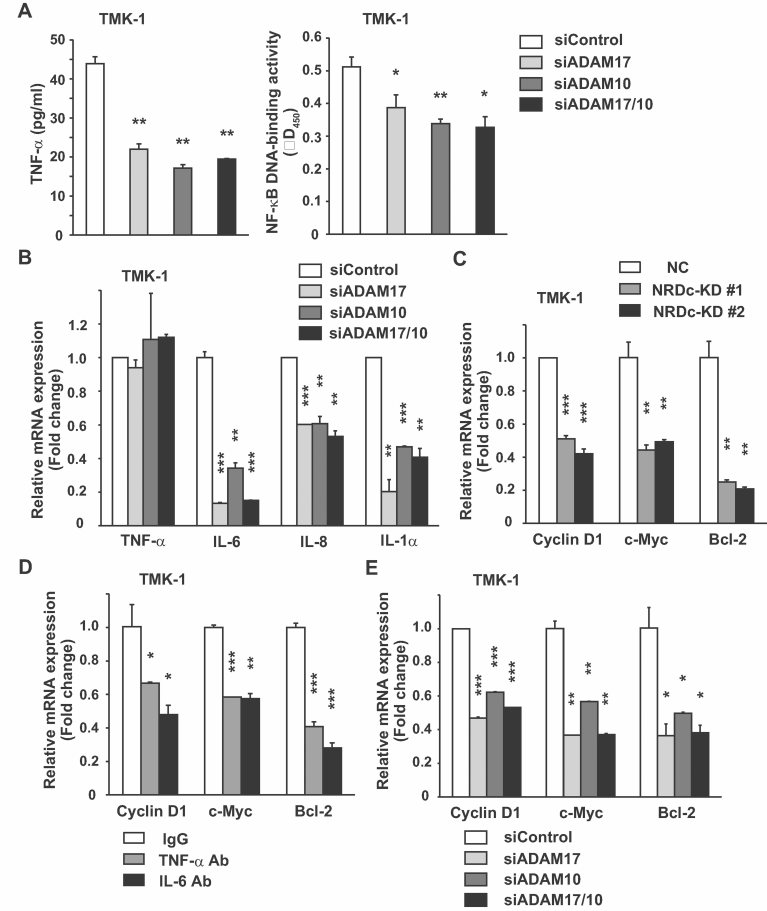
Left panel, TMK-1 cells were transfected with control siRNA or siRNA targeting ADAM17, ADAM10 or their combination. At 48 h after transfection, medium was changed to RPMI containing 0.1% BSA. CM was prepared after the cells were cultured for additional 48 h, and TNF-α in CM was quantified by ELISA. Right panel, NF-κB p65 DNA-binding activity was measured at 72 h after each siRNA was introduced into TMK-1 cells.
At 72 h after TMK-1 cells were transfected with each siRNA, qRT-PCR was performed for the indicated genes.
qRT-PCR analyses for cyclin D1, c-Myc and Bcl-2 mRNA levels in the stable TMK-1 clones.
A subconfluent monolayer of TMK-1 cells was treated with 2 µg/ml control IgG, anti-TNF-α neutralizing antibody, or anti-IL-6 neutralizing antibody for 24 h. Then, mRNA levels were measured by qRT-PCR.
mRNA levels of the indicated genes in TMK-1 cells were quantified by RT-PCR after siRNA-mediated knockdown of ADAM17, ADAM10 or both genes for 72 h.
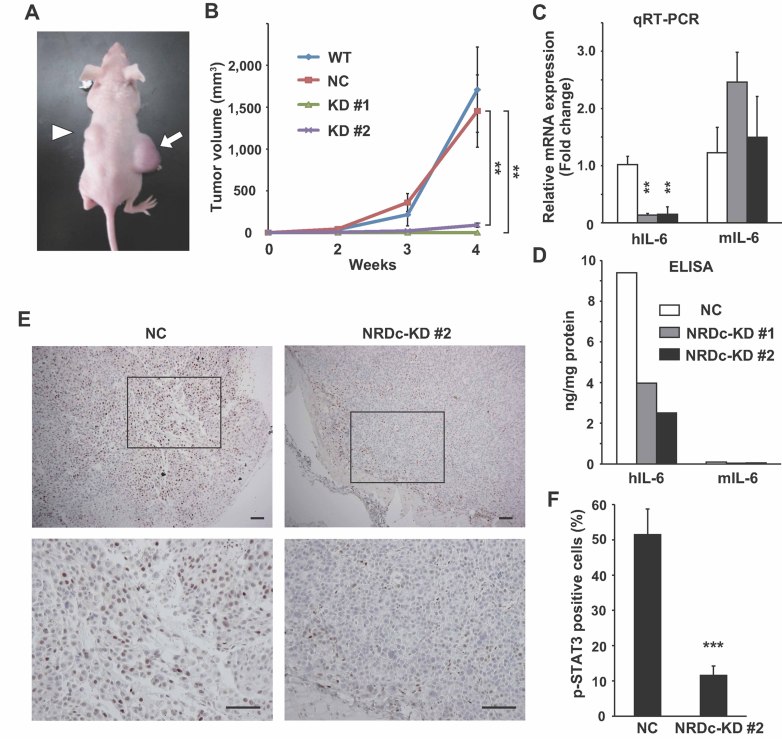
The WT or each stable TMK-1 cells were injected subcutaneously into the flanks of nude mice. The photograph shows the representative tumours grown from the NC (arrow) and NRDc-KD #2 cells (arrowhead) at 4 weeks after inoculation.
Tumour volume of each xenograft calculated at the indicated time points is plotted. Combined results of two-independent experiments are shown as mean ± SEM with total n = 8 per each clone.
qRT-PCR was performed using RNA extracted from tumours at 4 weeks after xenotransplantation. Data represent mean ± SEM of three-independent tumours of each clone.
Human or mouse IL-6 protein concentration in the indicated tumours was quantified using species-specific ELISA kits.
Tumour tissues at 4 weeks after xenografting were processed for immunohistochemical analysis with anti-phspho-STAT3 antibody. Representative microphotographs of tumours from the NC (left panels) or KD #2 TMK-1 cells (right panels) are shown. Lower panels are magnified photographs of the boxed areas. Scale bar, 100 µm.
Ratios of the tumour cells expressing p-STAT3 in the peripheral regions of the grown tumours are shown. Values represent mean ± SD from randomly selected tumour fields (n = 10).
Similar articles
-
Ectodomain shedding of TNF-alpha is enhanced by nardilysin via activation of ADAM proteases.Biochem Biophys Res Commun. 2008 May 23;370(1):154-8. doi: 10.1016/j.bbrc.2008.03.050. Epub 2008 Mar 18. Biochem Biophys Res Commun. 2008. PMID: 18355445
-
Nardilysin enhances ectodomain shedding of heparin-binding epidermal growth factor-like growth factor through activation of tumor necrosis factor-alpha-converting enzyme.J Biol Chem. 2006 Oct 13;281(41):31164-72. doi: 10.1074/jbc.M601316200. Epub 2006 Aug 21. J Biol Chem. 2006. PMID: 16923819
-
Nardilysin regulates inflammation, metaplasia, and tumors in murine stomach.Sci Rep. 2017 Feb 23;7:43052. doi: 10.1038/srep43052. Sci Rep. 2017. PMID: 28230087 Free PMC article.
-
Metalloproteinase inhibitors for the disintegrin-like metalloproteinases ADAM10 and ADAM17 that differentially block constitutive and phorbol ester-inducible shedding of cell surface molecules.Comb Chem High Throughput Screen. 2005 Mar;8(2):161-71. doi: 10.2174/1386207053258488. Comb Chem High Throughput Screen. 2005. PMID: 15777180 Review.
-
ADAM-Mediated Signalling Pathways in Gastrointestinal Cancer Formation.Int J Mol Sci. 2020 Jul 20;21(14):5133. doi: 10.3390/ijms21145133. Int J Mol Sci. 2020. PMID: 32698506 Free PMC article. Review.
Cited by
-
ADAM17 mediates hypoxia-induced drug resistance in hepatocellular carcinoma cells through activation of EGFR/PI3K/Akt pathway.Mol Cell Biochem. 2013 Aug;380(1-2):57-66. doi: 10.1007/s11010-013-1657-z. Epub 2013 Apr 28. Mol Cell Biochem. 2013. PMID: 23625205
-
CagA orchestrates eEF1A1 and PKCδ to induce interleukin-6 expression in Helicobacter pylori-infected gastric epithelial cells.Gut Pathog. 2020 Jul 3;12:31. doi: 10.1186/s13099-020-00368-3. eCollection 2020. Gut Pathog. 2020. PMID: 32636937 Free PMC article.
-
Nardilysin controls intestinal tumorigenesis through HDAC1/p53-dependent transcriptional regulation.JCI Insight. 2018 Apr 19;3(8):e91316. doi: 10.1172/jci.insight.91316. eCollection 2018 Apr 19. JCI Insight. 2018. PMID: 29669932 Free PMC article.
-
Molecular Abnormalities and Carcinogenesis in Barrett's Esophagus: Implications for Cancer Treatment and Prevention.Genes (Basel). 2025 Feb 25;16(3):270. doi: 10.3390/genes16030270. Genes (Basel). 2025. PMID: 40149421 Free PMC article. Review.
-
Proteomic Study to Survey the CIGB-552 Antitumor Effect.Biomed Res Int. 2015;2015:124082. doi: 10.1155/2015/124082. Epub 2015 Oct 20. Biomed Res Int. 2015. PMID: 26576414 Free PMC article.
References
-
- Balkwill F. Cancer and the chemokine network. Nat Rev Cancer. 2004;4:540–550. - PubMed
-
- Balkwill F. Tumour necrosis factor and cancer. Nat Rev Cancer. 2009;9:361–371. - PubMed
-
- Black RA, Rauch CT, Kozlosky CJ, Peschon JJ, Slack JL, Wolfson MF, Castner BJ, Stocking KL, Reddy P, Srinivasan S, et al. A metalloproteinase disintegrin that releases tumour-necrosis factor-alpha from cells. Nature. 1997;385:729–733. - PubMed
-
- Blobel CP. ADAMs: key components in EGFR signalling and development. Nat Rev Mol Cell Biol. 2005;6:32–43. - PubMed
-
- Bollrath J, Phesse TJ, von Burstin VA, Putoczki T, Bennecke M, Bateman T, Nebelsiek T, Lundgren-May T, Canli O, Schwitalla S, et al. gp130-mediated Stat3 activation in enterocytes regulates cell survival and cell-cycle progression during colitis-associated tumorigenesis. Cancer Cell. 2009;15:91–102. - PubMed
Publication types
MeSH terms
Substances
LinkOut - more resources
Full Text Sources
Medical
Molecular Biology Databases
Miscellaneous
