. 2012 Apr 15;590(8):1921-41.
doi: 10.1113/jphysiol.2011.222414. Epub 2012 Feb 20.

Adenosine 5-diphosphate-ribose is a neural regulator in primate and murine large intestine along with β-NAD(+)

Affiliations

Adenosine 5-diphosphate-ribose is a neural regulator in primate and murine large intestine along with β-NAD(+)

Leonie Durnin et al. J Physiol. .

Abstract

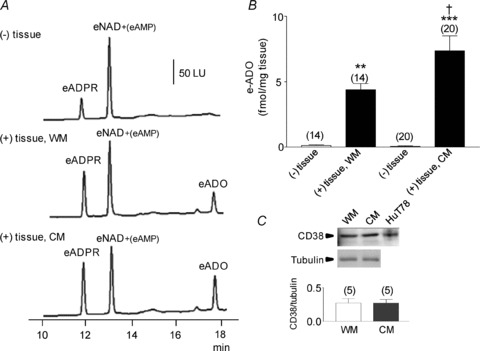
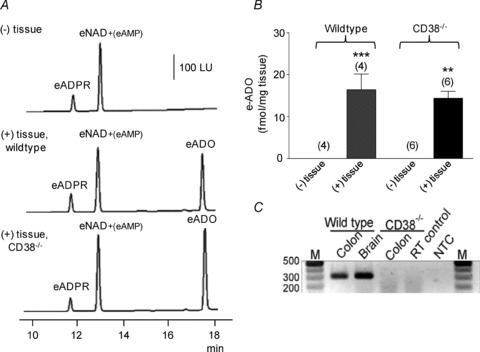
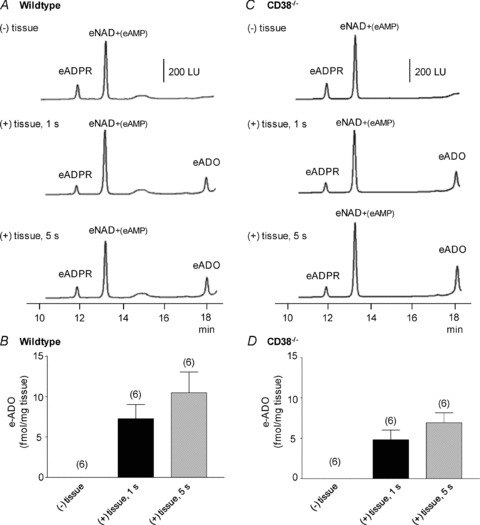
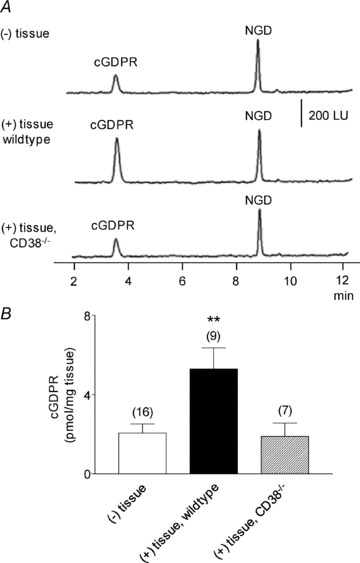
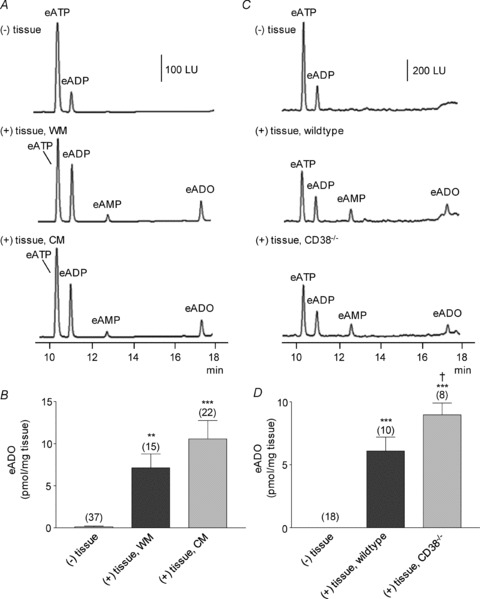
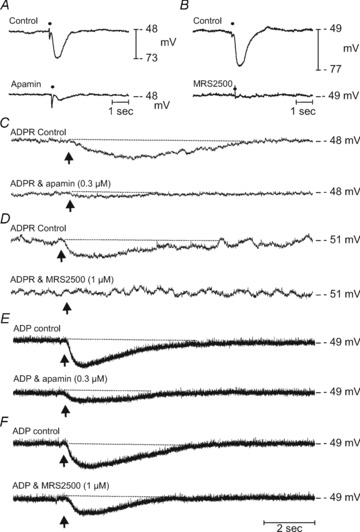
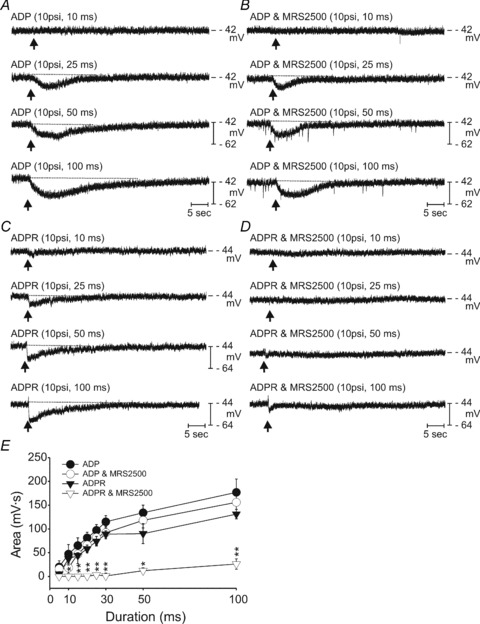
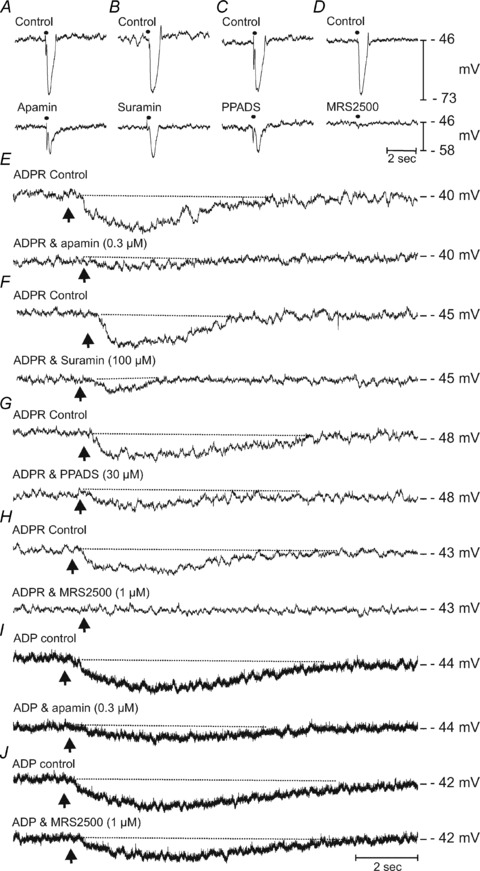
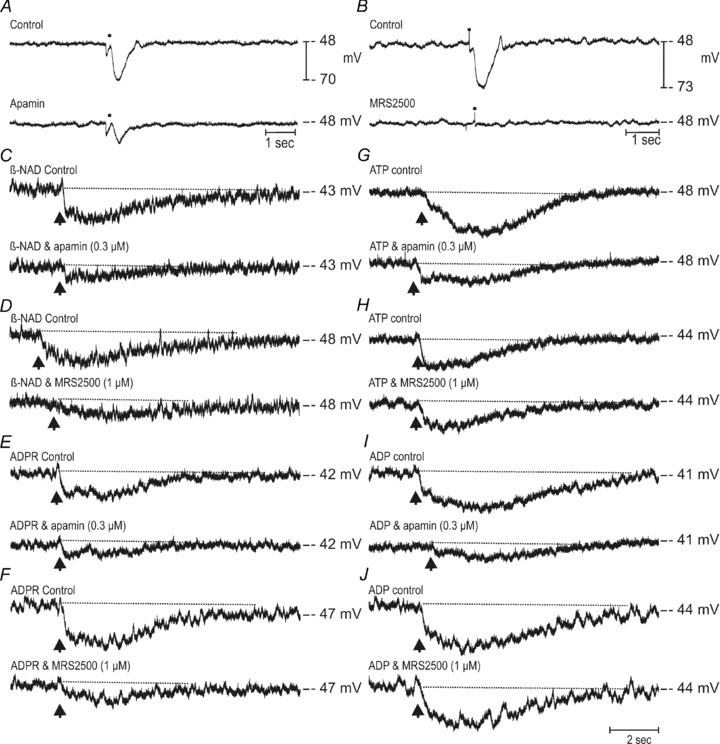
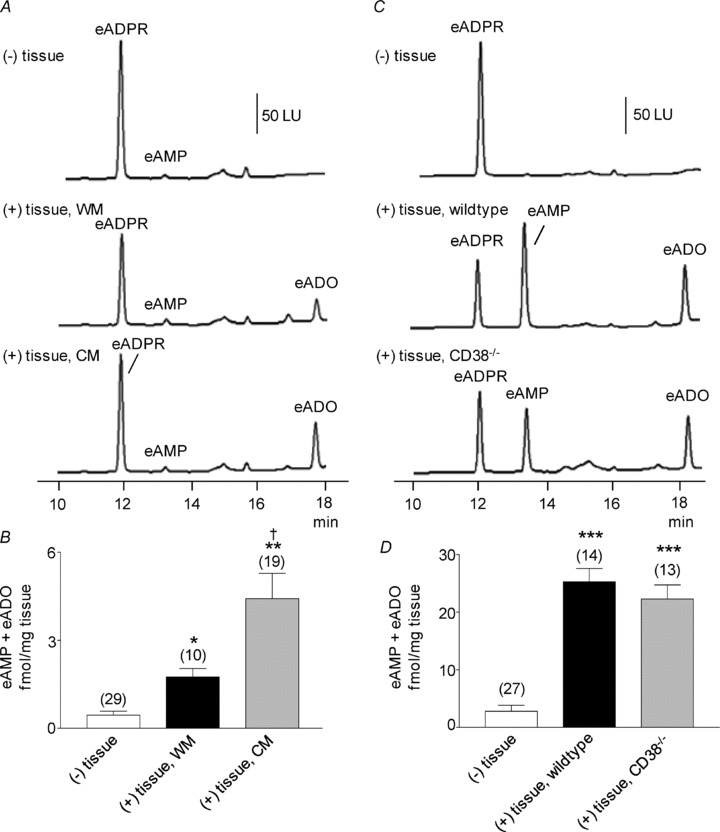
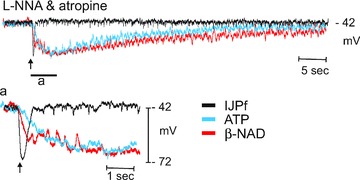
Adenosine 5′-triphosphate (ATP) has long been considered to be the purine inhibitory neurotransmitter in gastrointestinal (GI) muscles, but recent studies indicate that another purine nucleotide, β-nicotinamide adenine dinucleotide (β-NAD(+)), meets pre- and postsynaptic criteria for a neurotransmitter better than ATP in primate and murine colons. Using a small-volume superfusion assay and HPLC with fluorescence detection and intracellular microelectrode techniques we compared β-NAD(+) and ATP metabolism and postjunctional effects of the primary extracellular metabolites of β-NAD(+) and ATP, namely ADP-ribose (ADPR) and ADP in colonic muscles from cynomolgus monkeys and wild-type (CD38(+/+)) and CD38(−/−) mice. ADPR and ADP caused membrane hyperpolarization that, like nerve-evoked inhibitory junctional potentials (IJPs), were inhibited by apamin. IJPs and hyperpolarization responses to ADPR, but not ADP, were inhibited by the P2Y1 receptor antagonist (1R,2S,4S,5S)-4-[2-iodo-6-(methylamino)-9H-purin-9-yl]-2-(phosphonooxy)bicyclo[3.1.0]hexane-1-methanol dihydrogen phosphate ester tetraammonium salt (MRS2500). Degradation of β-NAD(+) and ADPR was greater per unit mass in muscles containing only nerve processes than in muscles also containing myenteric ganglia. Thus, mechanisms for generation of ADPR from β-NAD(+) and for termination of the action of ADPR are likely to be present near sites of neurotransmitter release. Degradation of β-NAD(+) to ADPR and other metabolites appears to be mediated by pathways besides CD38, the main NAD-glycohydrolase in mammals. Degradation of β-NAD(+) and ATP were equal in colon. ADPR like its precursor, β-NAD(+), mimicked the effects of the endogenous purine neurotransmitter in primate and murine colons. Taken together, our observations support a novel hypothesis in which multiple purines contribute to enteric inhibitory regulation of gastrointestinal motility.


Figures

Figure 1
Figure 1. Degradation of eNAD in monkey whole muscle (WM) and circular muscle (CM) colon preparations
A, original chromatograms of eNAD (0.2 μm) in the absence, (–) tissue, and presence, (+) tissue, of either WM or CM (30 s contact of substrate with tissue). The formation of eADPR and eADO was increased in the (+) tissue samples. No noticeable changes were observed in the peak of eNAD at 12.5 min, because this peak also contains eAMP formed from eNAD; LU, luminescence units. B, graphic representation of eADO formation in superfusate samples collected in the absence (–) or presence (+) of tissue. Note the increased formation of eADO in both WM and CM; the formation of eADO was greater in CM than WM. Asterisks denote significant differences from the amounts of eADO in (–) tissue samples (**P < 0.01, ***P < 0.001). There is a significant difference a significant increase in CM as compared to WM (†P < 0.05); number of experiments in parentheses. C, Western immunoblot analysis of CD38 showed no significant differences between the protein levels of CD38 in WM and CM. Density of each band is normalized to tubulin, which was used to control equal protein loading.
Figure 2
Figure 2. Degradation of eNAD in colon preparations isolated from wild-type and CD38−/− mice
A, original chromatograms of eNAD (0.2 μm) in the absence, (–) tissue, and presence, (+) tissue, of wild-type and CD38−/− colons. Note the increase in eADO formation in the (+) tissue samples after 30 s contact of substrate with tissue. No noticeable changes were observed in the peak of eNAD at 12.5 min, because this peak also contains eAMP formed from eNAD. LU, luminescence units. B, graphic representation of eADO formation in superfusate samples collected in the absence (–) or presence (+) of tissue. eADO was formed in the presence of tissues. Note that the formation of eADO was comparable in preparations isolated from CD38+/+ and CD38−/− mice. Asterisks denote significant differences from the amounts of eADO in (–) tissue samples (**P < 0.01, ***P < 0.001); number of experiments in parentheses. C, genotyping confirms absence of CD38 from CD38−/− mice. The presence of CD38 (301 bp) was confirmed in the colons of wild-type controls but was absent in CD38−/− mice. The presence of CD38 was also confirmed in the brains of wild-type controls. RT control represents reverse transcriptase control and NTC represents non-template control.
Figure 3
Figure 3. Degradation of eNAD after brief contacts with murine colon
A and C, original chromatograms of 0.2 μm eNAD in the absence of tissue, (–) tissue, and after 1 s and 5 s contact of eNAD with colon muscles isolated from wild-type mice (A) and colons isolated from CD38−/− mice (C). Note the appearance of the end product, eADO, in tissue superfusates after these brief exposures to eNAD. LU, luminescence units. B and D, graphic representation of eADO formation in superfusate samples collected in the absence (–) or presence (+) of tissue in colonic preparations isolated from wild-type (B) and CD38−/− (D) mice; number of experiments in parentheses.
Figure 4
Figure 4. Degradation of NGD in colon preparations isolated from wild-type and CD38−/− mice
A, original chromatograms of 0.2 mm NGD in the absence (–) tissue and presence of wild-type and CD38−/− colons. Note the increase in cGDPR formation in the (+) tissue samples from colon preparations isolated from wild-type mice and lack of increase in cGDPR in colon preparations isolated from CD38−/− mice. LU, luminescence units. B, graphic representation of cGDPR formation in superfusate samples collected in the absence (–) or presence (+) of tissue. Asterisks denote significant differences from the amounts of cGDPR in (–) tissue samples (**P < 0.01); number of experiments in parentheses.
Figure 5
Figure 5. Degradation of eATP in colon preparations isolated from monkey and murine large intestine
A, original chromatograms of eATP (0.05 μm) in the absence, (–) tissue, and presence, (+) tissue, of WM and CM of monkey colons. Note the increase in eADP, eAMP and eADO in the (+) tissue samples. LU, luminescence units. B, graphic representation of eADO formation in superfusate samples collected in the absence (–) or presence (+) of tissue. Asterisks denote significant differences vs. amounts in (–) tissue samples (**P < 0.01, ***P < 0.001); number of experiments in parentheses. C, original chromatograms of eATP (0.05 μm) in the absence, (–) tissue, and presence, (+) tissue, of colonic preparations isolated from wild-type and CD38−/− mice. eATP was decreased and eAMP and eADO were increased in both groups of preparations. LU, luminescence units. D, graphic representation of eADO formation in superfusate samples collected in the absence (–) or presence (+) of tissue. Asterisks denote significant differences from the amounts of eADO in (–) tissue samples (***P < 0.001). †Significant difference from CD38+/+ samples (P < 0.05); number of experiments in parentheses.
Figure 6
Figure 6. Inhibitory junction potentials and effects of ADPR and ADP on membrane potential of monkey colonic muscles
A and B, electrical field stimulation (single pulse 0.5 ms duration; point of stimulation indicated by •), performed in the presence of atropine (1 μm) and l-NNA (100 μm) of monkey colonic circular muscles produced large inhibitory junction potentials (IJPs, control in both A and B) that were greatly attenuated or inhibited by apamin (0.3 μm; A) or by MRS2500 (1 μm; B). C and D, picospritzed ADPR (10 mm loaded in a spritz pipette, arrow, upper traces) produced robust and sustained membrane hyperpolarizations that were inhibited by apamin (0.3 μm) and MRS2500, (1 μm) respectively (lower traces in both panels). E and F, membrane hyperpolarizations induced by ADP (10 mm loaded in a spritz pipette, arrows upper traces) were also reduced by apamin (0.3 μm) and to a lesser extent by MRS2500 (1 μm; lower traces in each panel).
Figure 7
Figure 7. Concentration–response relationship for ADPR and ADP on membrane hyperpolarizations in murine colon
A, a series of responses to spritzes of ADP (10 mm in spritz pipette) using pulse durations from 10–100 ms. Note the increase in hyperpolarization response as the spritz pulse is increased. B, responses to ADP after addition of MRS2500 (1 μm) to the bath solution. This P2Y1 antagonist only slightly decreased the area of the hyperpolarization responses to ADP. The fast voltage transients superimposed upon the record in B are due to static electricity. C, spritz responses to ADPR (10 mm in spritz pipette) using pulse durations from 10 to 100 ms. D, blockade of responses to ADPR after addition of MRS2500. The records in panels A–D were recorded during a single continuous impalement. E, summary of the results from 5 experiments using this protocol. Hyperpolarization responses were tabulated as areas under the response curves (mV s). *P < 0.01; **P < 0.001.
Figure 8
Figure 8. Effects of ADPR and ADP on membrane potential and inhibitory junction potentials of colonic circular muscle cells from wild-type CD38+/+ mice
AD show IJP evoked by EFS (single pulse 0.5 ms duration, •) in the presence of atropine (1 μm) and l-NNA (100 μm) (Control, upper traces in each panel) and after apamin (0.3 μm; A), suramin (100 μm; B), PPADS (30 μm; C) and MRS2500 (1 μm; D) (lower traces in each panel). Control responses were all recorded in the presence of atropine (1 μm) and l-NNA (100 μm). E–H shows the effects of ADPR (10 mm loaded in a spritz pipette, picospritzed onto circular muscles) at a time point indicated by arrow. Upper traces of each panel represent control responses recorded in the presence of atropine (1 μm) and l-NNA (100 μm). ADPR produced reproducible membrane hyperpolarizations which were sustained for several seconds before returning to pre-stimulus levels. ADPR-induced membrane hyperpolarizations were antagonized by apamin (0.3 μm; E), and the P2Y receptor antagonists, suramin (100 μm; F), PPADS (30 μm; G) and MRS2500 (1 μm; H). I and J shows the effects of ADP (10 mm, picospritzed) on murine colonic circular muscles before (upper traces) and in the presence of apamin (0.3 μm; I) and MRS2500 (1 μm; J). Apamin antagonized the membrane hyperpolarizations induced by ADP.
Figure 9
Figure 9. Effects of β-NAD+, ATP, ADPR and ADP on membrane potential and inhibitory junction potentials of colonic circular muscles from CD38−/− mice
A and B, IJPs recorded from colonic circular muscles of CD38 null mice under control conditions (upper traces) and after apamin (A; lower trace) or MRS2500 (B; lower trace). Control conditions represent experiments that were performed in the presence of atropine (1 μm) and l-NNA (100 μm). C and D, β-NAD+ induced membrane hyperpolarizations (50 mm loaded in a spritz pipette, picospritzed at arrow) before (upper traces) and in the presence of apamin (0.3 μm; lower trace C) and MRS2500 (1 μm; lower trace D). E and F, membrane hyperpolarizations to ADPR (10 mm, picospritzed at arrow) before (upper traces) and in the presence of apamin (0.3 μm; lower trace E) or MRS2500 (1 μm; lower trace F). G and H, membrane hyperpolarizations in responses to picospritzed ATP (10 mm, upper traces in each panel) and in the presence of apamin (0.3 μm; lower trace G) or MRS2500 (1 μm; lower trace H). I and J, the effects of ADP on membrane potential under control conditions (10 mm, upper traces in each panel) and after apamin (0.3 μm; lower trace I) or MRS2500 (1 μm; lower trace J).
Figure 10
Figure 10. Degradation of eADPR in colon preparations isolated from monkey and murine large intestine
A, original chromatograms of eADPR (0.05 μm) in the absence, (–) tissue, and presence, (+) tissue, of WM and CM of monkey colons. Note the decrease in eADPR and increase in eADO in the (+) tissue samples. LU, luminescence units. B, graphic representation of eAMP + eADO formation in superfusate samples collected in the absence (–) or presence (+) of tissue. Note that the formation of eAMP + eADO product was greater in CM than in WM. Asterisks denote significant differences from the amounts of eAMP + eADO in (–) tissue samples (*P < 0.05, **P < 0.01). †Significant difference from WM (P < 0.05); number of experiments in parentheses. C, original chromatograms of 0.05 μm eADPR in the absence, (–) tissue, and presence, (+) tissue, of colonic preparations isolated from wild-type and CD38−/− mice. eADPR was decreased and eAMP + eADO was increased in both groups of preparations. LU, luminescence units. D, graphic representation of eAMP + eADO formation in superfusate samples collected in the absence (–) or presence (+) of tissue. Asterisks denote significant differences from the amounts of eAMP + eADO in (–) tissue samples (***P < 0.001); number of experiments in parentheses.
Figure 11
Figure 11. Superposition of inhibitory junction potential (IJP) and hyperpolarization responses to exogenous ATP and β-NAD spritzed near the site of recording in a murine colonic preparation
This experiment demonstrates the kinetic differences in responses to the endogenous purinergic neurotransmitter released from nerve terminals and hyperpolarization responses to exogenous transmitter candidates. Single pulses (0.5 ms pulse duration) of electrical field stimulation released neurotransmitter that resulted in fast inhibitory junction potentials (IJPs). The time constant of the upstroke of the IJPs, fitted by a single exponential (Clampfit; Molecular Devices, Sunnyvale, CA, USA), was 135 ± 8 ms (n= 41). In contrast responses to spritzed neurotransmitter candidates (10 psi; 25 ms pulses) developed more slowly (amplitudes scaled to approximate amplitude of the IJP); time constants for ATP (10 mm in spritz pipette) and β-NAD (50 mm in picospritz pipette) averaged 1217 ± 159 (n= 20) and 1001 ± 149 (n= 21), respectively. These data demonstrate that substantially more time is required for exogenous compounds to reach and bind receptors and for responses to develop than is required for the responses to neurotransmitters released from neurons. This implies that responses to neurotransmitters are transduced by postjunctional receptive fields quite close to the sites of release. These data also indicate that sites of neurotransmitter metabolism might be more accessible to transmitters released from neurons than to exogenous transmitter candidates. Thus, the kinetics of metabolism of exogenous substances may underestimate the kinetics of metabolism of endogenous transmitters by nearly an order of magnitude.

Similar articles

Cited by

References

    1. Abbracchio MP, Burnstock G, Verkhratsky A, Zimmermann H. Purinergic signalling in the nervous system: an overview. Trends Neurosci. 2009;32:19–29. - PubMed
    1. Agteresch HJ, Dagnelie PC, van den Berg JW, Wilson JH. Adenosine triphosphate: established and potential clinical applications. Drugs. 1999;58:211–232. - PubMed
    1. Beckett EA, Bayguinov YR, Sanders KM, Ward SM, Hirst GD. Properties of unitary potentials generated by intramuscular interstitial cells of Cajal in the murine and guinea-pig gastric fundus. J Physiol. 2004;559:259–269. - PMC - PubMed
    1. Bobalova J, Mutafova-Yambolieva VN. Co-release of endogenous ATP and noradrenaline from guinea-pig mesenteric veins exceeds co-release from mesenteric arteries. Clin Exp Pharmacol Physiol. 2001;28:397–401. - PubMed
    1. Bobalova J, Mutafova-Yambolieva VN. Membrane-bound and releasable nucleotidase activities: differences in canine mesenteric artery and vein. Clin Exp Pharmacol Physiol. 2003;30:194–202. - PubMed

Publication types

MeSH terms