. 2012 Apr 6;287(15):11968-80.
doi: 10.1074/jbc.M111.336834. Epub 2012 Feb 17.

Myonectin (CTRP15), a novel myokine that links skeletal muscle to systemic lipid homeostasis

Affiliations

Myonectin (CTRP15), a novel myokine that links skeletal muscle to systemic lipid homeostasis

Marcus M Seldin et al. J Biol Chem. .

Abstract

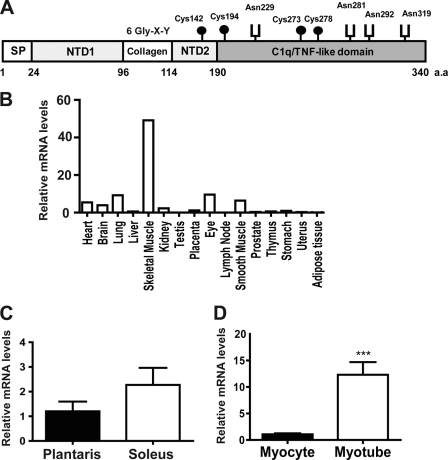
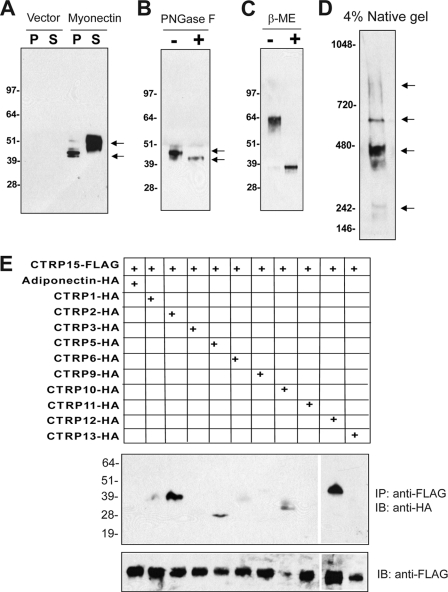
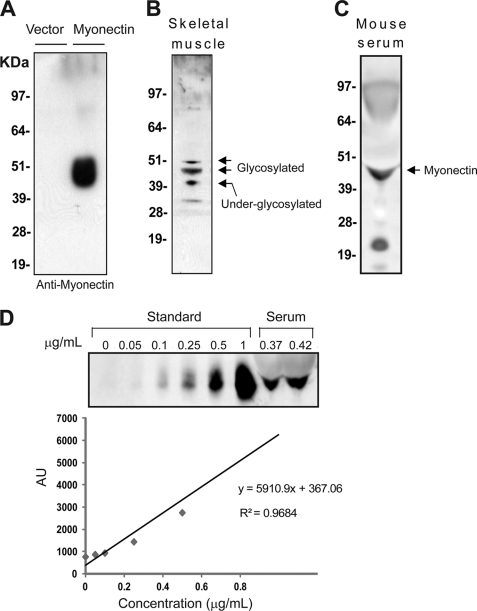
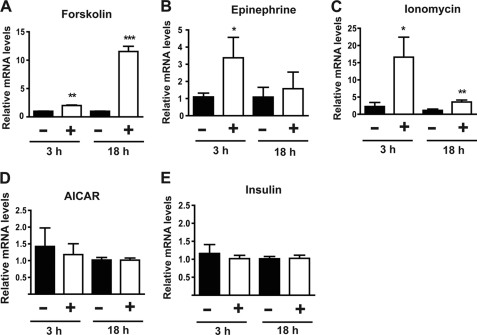
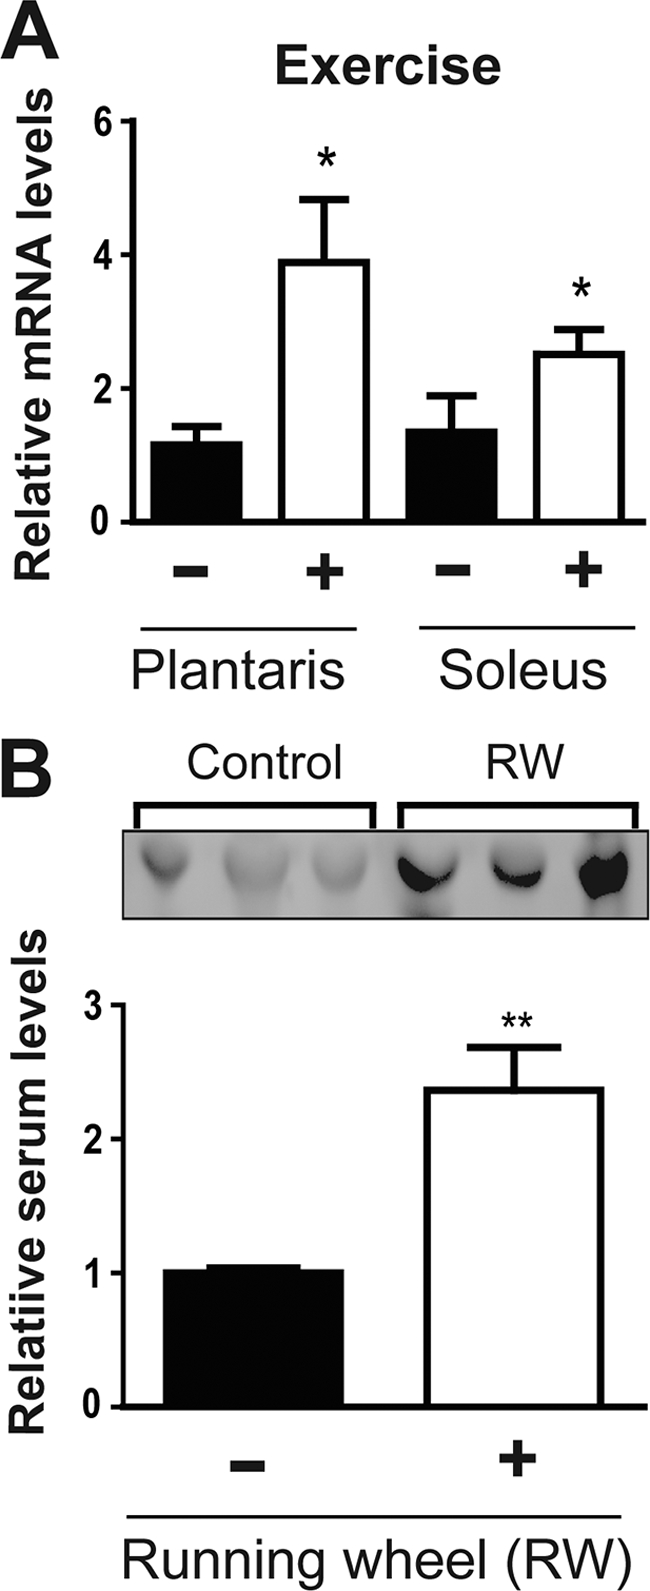
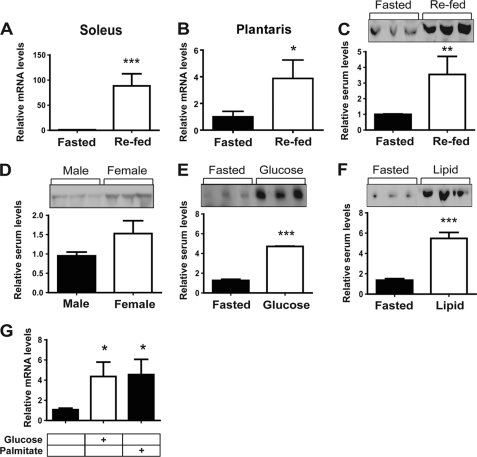
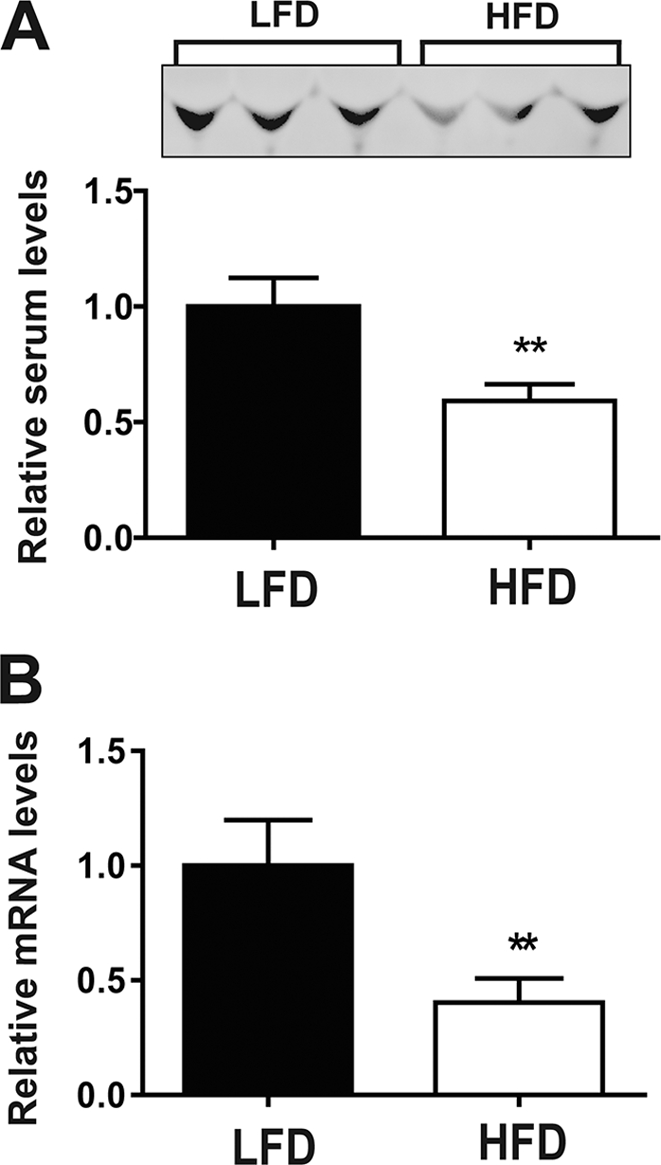
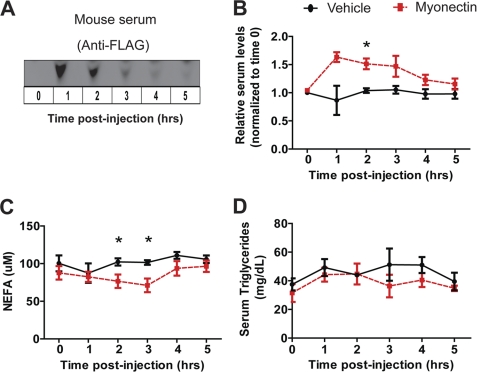
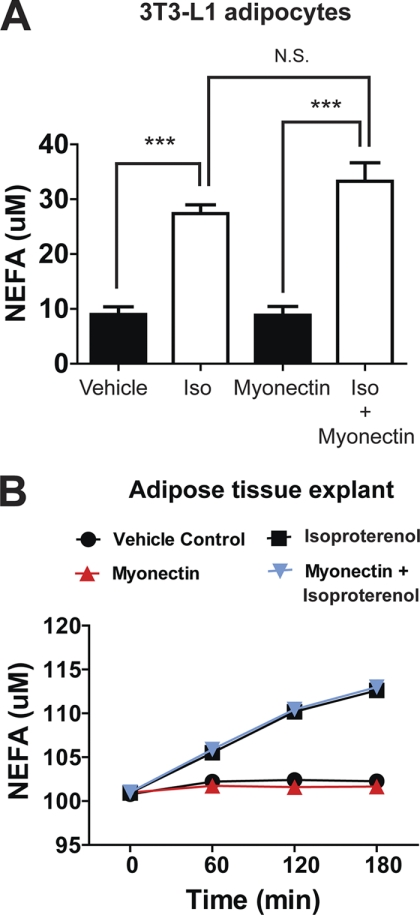
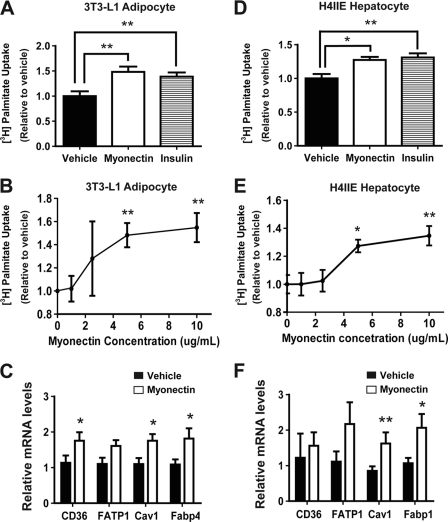
Skeletal muscle plays important roles in whole-body glucose and fatty acid metabolism. However, muscle also secretes cytokines and growth factors (collectively termed myokines) that can potentially act in an autocrine, a paracrine, and/or an endocrine manner to modulate metabolic, inflammatory, and other processes. Here, we report the identification and characterization of myonectin, a novel myokine belonging to the C1q/TNF-related protein (CTRP) family. Myonectin transcript was highly induced in differentiated myotubes and predominantly expressed by skeletal muscle. Circulating levels of myonectin were tightly regulated by the metabolic state; fasting suppressed, but refeeding dramatically increased, its mRNA and serum levels. Although mRNA and circulating levels of myonectin were reduced in a diet-induced obese state, voluntary exercise increased its expression and circulating levels. Accordingly, myonectin transcript was up-regulated by compounds (forskolin, epinephrine, ionomycin) that raise cellular cAMP or calcium levels. In vitro, secreted myonectin forms disulfide-linked oligomers, and when co-expressed, forms heteromeric complexes with other members of the C1q/TNF-related protein family. In mice, recombinant myonectin administration reduced circulating levels of free fatty acids without altering adipose tissue lipolysis. Consistent with this, myonectin promoted fatty acid uptake in cultured adipocytes and hepatocytes, in part by up-regulating the expression of genes (CD36, FATP1, Fabp1, and Fabp4) that promote lipid uptake. Collectively, these results suggest that myonectin links skeletal muscle to lipid homeostasis in liver and adipose tissue in response to alterations in energy state, revealing a novel myonectin-mediated metabolic circuit.


Figures

FIGURE 1.
FIGURE 1.
The deduced myonectin protein and its expression in skeletal muscle and cultured myotubes. A, the deduced domain structure of mouse myonectin. SP, signal peptide; NTD1, N-terminal domain-1; NTD2, N-terminal domain-2; a.a., amino acids. B, expression profile of myonectin in mouse tissues. C, expression of myonectin transcript in isolated plantaris and soleus muscle fiber type (n = 5 per group). D, expression of myonectin transcript in undifferentiated mouse C2C12 myocytes and differentiated myotubes (n = 8 per group). All quantitative real-time PCR data were normalized to 18 S rRNA and expressed as mean ± S.E. (***, p < 0.005).
FIGURE 2.
FIGURE 2.
Myonectin is secreted as a multimeric protein that can form heteromeric complexes with other CTRP family members. A, immunoblot analysis of cell pellet (P) or supernatant (S) from transfected HEK 293T cells expressing pCDNA3.1 control vector or FLAG epitope-tagged myonectin. B and C, immunoblot analysis of myonectin subjected to N-glycosidase F (PNGase F) (B) or β-mercaptoethanol (β-ME) (C) treatment. D, native gel immunoblot analysis of myonectin. Arrows in panels A and B, indicate possible isoforms of myonectin resulting from differential glycosylation. Arrows in panel D indicate different oligomeric forms of myonectin. E, immunoprecipitation (IP) followed by immunoblot (IB) analysis of supernatants from HEK 293T cells expressing a combination of FLAG-tagged myonectin and HA-tagged adiponectin or CTRPs.
FIGURE 3.
FIGURE 3.
Myonectin is produced by skeletal muscle and circulates in plasma. A, immunoblot analysis of supernatant from HEK 293T cells expressing control vector or FLAG-tagged myonectin using a rabbit anti-myonectin antibody. B, immunoblot detection of myonectin in mouse skeletal muscle lysate. Arrows indicate possible isoforms of myonectin resulting from differential glycosylation. C, immunoblot detection of myonectin in mouse serum. D, estimation of serum concentration of myonectin in wild-type 12-week-old C57BL/6J male mice. Purified recombinant myonectin was used to construct a standard curve. AU, arbitrary units.
FIGURE 4.
FIGURE 4.
Myonectin in expression in myotubes is up-regulated by increase in cellular cAMP or calcium levels. A–E, quantitative real-time PCR analysis of myonectin expression in mouse C2C12 myotubes treated with vehicle control or 1 μm forskolin (A); 1 μm epinephrine (B); 1 μm ionomycin (C); 1 mm AICAR (D); or 100 nm insulin (E). n = 8 for each experiment. All expression data were normalized to 18 S rRNA. All data are presented as mean ± S.E. relative to vehicle control (*, p < 0.05; **, p < 0.01; ***, p < 0.005).
FIGURE 5.
FIGURE 5.
Exercise increases myonectin expression in skeletal muscle as well as circulating levels. A, quantitative real-time PCR analysis of myonectin expression in plantaris and soleus muscle from mice given access to a running wheel (RW) for 2 weeks or matched controls with access to locked wheel. All expression data were normalized to 18 S rRNA. B, immunoblot analysis of serum myonectin from the same cohort of mice. All data are presented as mean ± S.E. relative to control mice (n = 6 mice/group; *, p < 0.05; **, p < 0.01).
FIGURE 6.
FIGURE 6.
Nutritional state regulates expression and circulating levels of myonectin. A–C, quantitative PCR analysis of myonectin expression in soleus (A) and plantaris muscle (B), as well as immunoblot quantification of serum levels (C) after a 12-h fast (Fasted) or fasted followed by 2 h of unrestricted food access (Re-fed) (n = 10 mice/group). All PCR data were normalized to 18 S rRNA. D, immunoblot quantification of serum myonectin levels in male and female mice subjected to a 12-h fast (n = 10 mice/group). E and F, immunoblot quantification of serum myonectin levels in mice subjected to a 12-h fast (Fasted) or fasted and gavaged with glucose (E) or emulsified intralipid (F) (n = 10 mice/group). G, quantitative PCR analysis of myonectin expression in C2C12 myotubes cultured in serum-free media containing no glucose/lipids (control) or treated with 25 mm glucose or 1 μm palmitate for 18 h (n = 8/group). All data are presented as mean ± S.E. relative to fasted mice or vehicle control (*, p < 0.05; **, p < 0.01; ***, p < 0.005).
FIGURE 7.
FIGURE 7.
High-fat diet reduces myonectin expression and its circulating levels. A, immunoblot quantification of serum myonectin levels in mice fed a high-fat diet (HFD) or an isocaloric matched low-fat diet (LFD) for 12 weeks. B, quantitative PCR analysis of myonectin expression in calf muscle isolated from low-fat diet- or high-fat diet-fed male mice. All data are presented as mean ± S.E. relative to low-fat diet-fed mice (n = 8 mice/group; **, p < 0.01).
FIGURE 8.
FIGURE 8.
Recombinant myonectin administration reduces serum nonesterified free fatty acid levels in mice. A, immunoblot detection of FLAG epitope-tagged myonectin in mouse serum before and after recombinant protein injection. B, immunoblot quantification revealed an ∼60% elevation in serum myonectin levels above normal baseline levels after recombinant protein injection (n = 5 per group). C and D, male mice were injected intraperitoneally with vehicle or myonectin (5 μg/g of body weight), and sera were harvested every hour for 5 h following recombinant protein administration. Food was removed 2 h prior to protein injection. Serum nonesterified fatty acid (C) and triglyceride (D) levels were quantified (n = 5 mice/group). All data are presented as mean ± S.E. (*, p < 0.05).
FIGURE 9.
FIGURE 9.
Recombinant myonectin has no effect on adipocytes or adipose tissue lipolysis. A, NEFA concentration in media of 3T3-L1 adipocytes treated for 1 h with vehicle, isoproterenol (1 μm), myonectin (5 μg/ml), or a combination of myonectin and isoproterenol (Iso, n = 12 per group). N.S., not significant. All data are presented as mean ± S.E. relative to vehicle control (***, p < 0.005). B, time course of NEFA release into conditioned media of adipose tissue (epididymal fat pad) explants treated with vehicle, isoproterenol (1 μm), myonectin (5 μg/ml), or a combination of myonectin and isoproterenol (n = 6 per group).
FIGURE 10.
FIGURE 10.
Myonectin enhances fatty acid uptake in 3T3-L1 adipocytes and H4IIE hepatocytes via transcriptional mechanism. A and D, mouse 3T3-L1 adipocytes (A) or rat H4IIE hepatocytes (D) were treated overnight with vehicle buffer, recombinant myonectin (5 μg/ml), or insulin (50 nm) and subjected to [3H]palmitate uptake assay for 10, 30, or 60 s (n = 8/group). Data represent cumulative uptake over 60 s. B and E, dose-response curves of [3H]palmitate uptake in 3T3-L1 adipocytes (B) and H4IIE hepatocytes (E) stimulated with various concentrations of myonectin. C and F, quantitative real-time PCR analysis of CD36, FATP1, Cav1, and FABP4 or FABP1 expression in adipocytes (C) or hepatocytes (F) treated with vehicle buffer or myonectin (5 μg/ml) for 12 h (n = 8/group). All expression data were normalized to 18 S rRNA. All data are presented as mean ± S.E. relative to vehicle control (*, p < 0.05; **, p < 0.01).

References

    1. Wasserman D. H., Ayala J. E. (2005) Interaction of physiological mechanisms in control of muscle glucose uptake. Clin. Exp. Pharmacol. Physiol. 32, 319–323 - PubMed
    1. Rasmussen B. B., Wolfe R. R. (1999) Regulation of fatty acid oxidation in skeletal muscle. Annu. Rev. Nutr. 19, 463–484 - PubMed
    1. Petersen K. F., Shulman G. I. (2002) Pathogenesis of skeletal muscle insulin resistance in type 2 diabetes mellitus. Am. J. Cardiol. 90, 11G–18G - PubMed
    1. Pedersen B. K. (2009) Edward F. Adolph distinguished lecture: muscle as an endocrine organ: IL-6 and other myokines. J. Appl. Physiol. 107, 1006–1014 - PubMed
    1. Henningsen J., Rigbolt K. T., Blagoev B., Pedersen B. K., Kratchmarova I. (2010) Dynamics of the skeletal muscle secretome during myoblast differentiation. Mol. Cell. Proteomics 9, 2482–2496 - PMC - PubMed

Publication types

MeSH terms

Associated data