. 2012 Mar 12;209(3):495-506.
doi: 10.1084/jem.20111413. Epub 2012 Feb 20.

Ovarian cancer progression is controlled by phenotypic changes in dendritic cells

Affiliations

Ovarian cancer progression is controlled by phenotypic changes in dendritic cells

Uciane K Scarlett et al. J Exp Med. .

Abstract

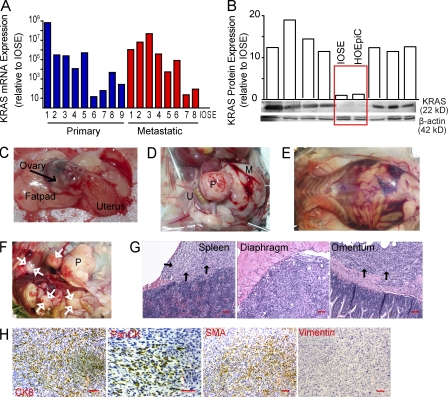
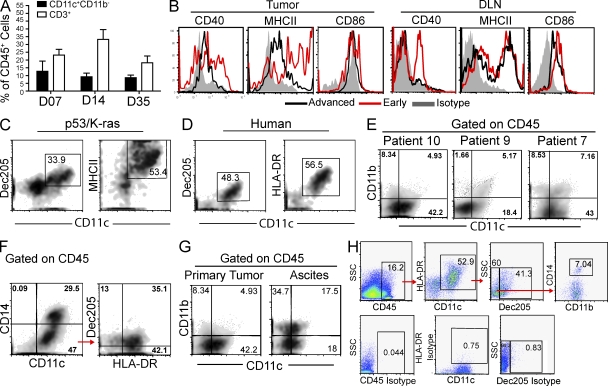
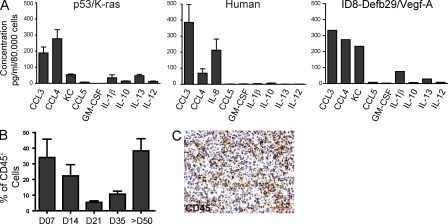
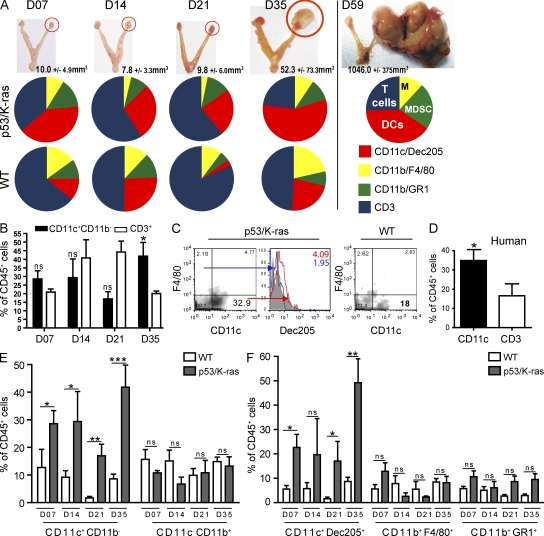
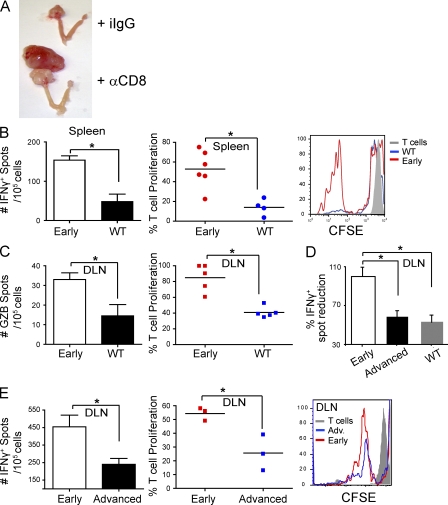
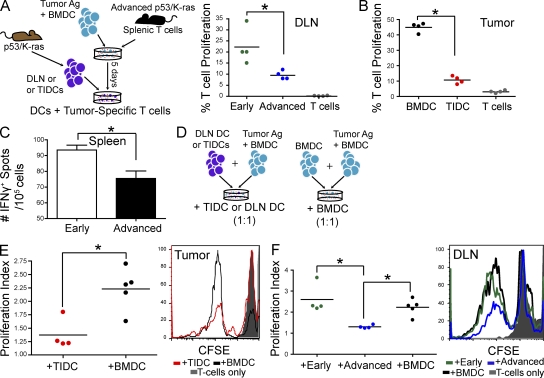
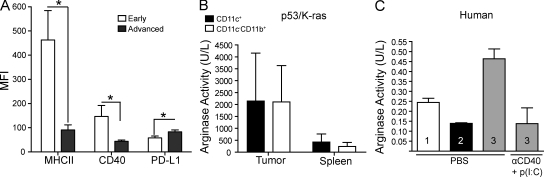
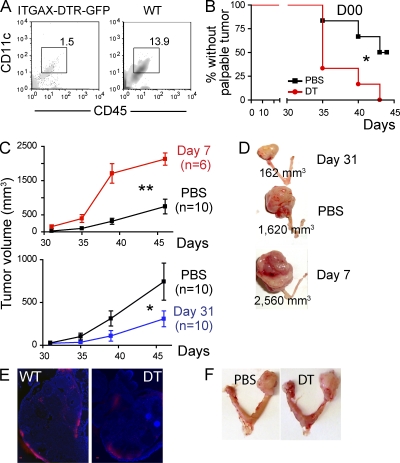
We characterized the initiation and evolution of the immune response against a new inducible p53-dependent model of aggressive ovarian carcinoma that recapitulates the leukocyte infiltrates and cytokine milieu of advanced human tumors. Unlike other models that initiate tumors before the development of a mature immune system, we detect measurable anti-tumor immunity from very early stages, which is driven by infiltrating dendritic cells (DCs) and prevents steady tumor growth for prolonged periods. Coinciding with a phenotypic switch in expanding DC infiltrates, tumors aggressively progress to terminal disease in a comparatively short time. Notably, tumor cells remain immunogenic at advanced stages, but anti-tumor T cells become less responsive, whereas their enduring activity is abrogated by different microenvironmental immunosuppressive DCs. Correspondingly, depleting DCs early in the disease course accelerates tumor expansion, but DC depletion at advanced stages significantly delays aggressive malignant progression. Our results indicate that phenotypically divergent DCs drive both immunosurveillance and accelerated malignant growth. We provide experimental support for the cancer immunoediting hypothesis, but we also show that aggressive cancer progression after a comparatively long latency period is primarily driven by the mobilization of immunosuppressive microenvironmental leukocytes, rather than loss of tumor immunogenicity.


Figures

Figure 1.
Figure 1.
The p53-dependent mouse model of ovarian carcinoma develops solid peritoneal tumor masses. (A) Expression of KRAS mRNA (normalized to GAPDH) in 17 representative cases of stage III–IV human ovarian carcinomas, relative to IOSE cells (immortalized cells from the normal ovarian epithelial surface). (B) Relative protein expression of K-ras (normalized to β-actin) in seven randomly selected stage III–IV human ovarian carcinoma specimens, IOSE cells, or HOSEpiC cells (healthy ovarian epithelial cells cryopreserved either at primary or passage one cultures). (C) Injection of trypan blue into the bursal cavity of transgenic mice. (D) Intrabursal adenoviral injection in p53/K-ras mice results in a primary solid ovarian tumor mass (P) with accompanying metastatic lesion (M). U, uterus. (E) Ascites detected in the peritoneal cavity of a chimeric p53/K-ras mouse injected with the adenovirus ∼50 d before. (F) Primary (P) and spontaneous metastatic masses (white arrows) in p53/K-ras mice 50 d after receiving adenovirus. (G) H&E of metastatic masses from indicated regions which appeared in mice 3 mo after undergoing resection of primary tumors at ∼35 d. Black arrows indicate tumor tissue. Bars, 100 µm. (H) p53/K-ras primary epithelial tumors stained for Cytokeratin 8 (CK8; ×100), Pan-Cytokeratin (PanCK; ×200), smooth muscle actin (SMA; ×100); and Vimentin (×100). Bars, 100 µm. Brightness, contrast, and color balance were uniformly adjusted in whole individual images.
Figure 2.
Figure 2.
The inflammatory microenvironment of p53/K-ras end-stage tumors recapitulates advanced human ovarian carcinoma. (A) Quantification at the indicated time points of cells found within the ovaries of WT animals (n = 8) after receiving adenovirus intrabursally. Gated on CD45+ cells. (B) Expression of indicated activation markers on CD45+CD11c+ DCs taken from tumors or DLN of p53/K-ras mice. Early, 7 d after AdvCre injection; Advanced, mice with advanced tumors. Representative density plots of dissociated tumors from p53/K-ras mice (C) and patients with stage III–IV ovarian carcinoma (gated on CD45; D). (E–G) Density flow plots of dissociated tumors from individual patients with stage III–IV ovarian carcinoma. (H) Gating strategy (above) and isotypes (below) for Table 1. Error bars, SEM.
Figure 3.
Figure 3.
DCs found within solid p53/K-ras tumors display similar proinflammatory attributes as human tumor-derived DCs. (A) Quantification of cytokines and chemokines secreted from sorted CD45+CD11c+Dec205+CD11b+/− cells from advanced human tumor specimens (n = 3) or CD45+CD11c+CD11b+ cells from tumors of end-stage p53/K-ras mice (n = 4) or ascites of WT mice bearing ID8-Defb29/Vegf-a tumors. (B) Proportion of CD45+ cells found within the ovaries of p53/K-ras mice (n = 6) at the indicated time points after adenovirus injection. (C) CD45 immunohistochemical analysis of resected tumors (>50 d) ×100. Error bars, SEM. Bar, 100 µm.
Figure 4.
Figure 4.
A change in the inflammatory microenvironment converges with the exponential growth of p53/K-ras tumors. (A) Top, images of explanted reproductive organs from p53/K-ras mice after receiving adenovirus. Middle and bottom, quantified flow analysis of resected tumors (red circle; primordial and advanced) from p53/K-ras (middle; n = 4–6) and WT (bottom; n = 6–8) animals, which received adenovirus previously. Slices represent mean percentages of CD45+ leukocytic infiltrates. (B) Comparative analysis of CD45+CD11c+CD11b and CD45+CD3+ cells infiltrating tumors of p53/K-ras mice at the indicated time points (n = 4–8). (C) Density plots of p53/K-ras tumors or WT ovaries which received adenovirus 35 d before (gated on CD45+ cells). Histogram of CD45+F4/80+CD11c (blue) and CD45+CD11c+F4/80 (red). Numbers in the right corner are respective mean fluorescence intensity (MFI). (D) Percentage of CD45+CD11c+ and CD45+CD3+ cells found within stage III/IV human ovarian carcinoma (n = 7). (E and F) Quantification of flow analysis at the indicated time points of ovaries from p53/K-ras (n = 4–6) or WT (n = 6–8) mice after adenovirus injection. Error bars, SEM. *, P < 0.05; **, P < 0.001; ***, P < 0.0001; ns, no significance).
Figure 5.
Figure 5.
Reduced adaptive immunity during accelerated tumor growth. (A) Representative images of differential tumor burden (primary plus metastatic growth) in mice challenged with intrabursal adenovirus-Cre that received depleting anti-CD8 (α-CD8) versus isotype control (iIgG) antibodies at days −2, 5, 12, and 19 (n = 4/group). (B) Left, ELISPOT analysis of IFN-γ produced by FACS-sorted CD45+CD11bCD11cSSClowCD8β+/CD4+ T cell splenocytes incubated with tumor pulsed BMDCs (10:1). Spleens are from either WT or p53/K-ras (early) animals that received adenovirus-Cre intrabursally 7 d before (n = 5 mice/group; two independent experiments). Middle, quantified proliferation of sorted T cell splenocytes from early tumor-bearing p53/K-ras or WT animals in response to BMDC-presented tumor antigens (n ≥ 5 mice/group; two independent experiments). Right, representative histogram of CFSE dilution in this experiment. (C) Left, ELISPOT analysis of Granzyme B (GZB) produced by CD45+CD11bCD11cSSClowCD8β+/CD4+ T cells FACS sorted from DLNs (renal) from the same mice, after incubation with tumor pulsed BMDCs (10:1). Middle, quantified proliferation of these lymphatic T cells in response to BMDC-presented tumor antigens. (D) Percentage of IFN-γ spots produced by CD45+CD11bCD11cSSClowCD8β+/CD4+ T cells sorted from the DLN of either WT mice that received adenovirus 7 d before, or p53/K-ras advanced tumor-bearing mice. Normalized to the number of spots produced by sorted DLN T cells from day 7 (early) tumor-bearing mice, which is considered 100% (n ≥ 4 mice/group; pooled from two independent experiments). (E) Left, ELISPOT analysis of IFN-γ produced by CD45+CD11bCD11cSSClowCD8β+/CD4+ T cells sorted from the DLN of p53/K-ras animals that received adenovirus-Cre intrabursally either 7 d (early) or >50 d (advanced) before. Middle, quantified proliferation of sorted T cells from the same mice in response to BMDC-presented tumor antigens (n = 3 mice/group; three independent experiments, total). Right, representative histogram of CFSE dilution in this experiment. Error bars, SEM. *, P < 0.05. Data points on scatter plots represent individual donors for spleens and experimental replicates for pooled DLN. Horizontal bars, SEM. Two independent experiments for all, unless otherwise specified.
Figure 6.
Figure 6.
Tumor-resident DCs are transformed from immunostimulatory to immunosuppressive during tumor progression. (A) Left, CD3+ T cells were obtained from spleens of advanced tumor-bearing p53/K-ras animals, and then added to cultures containing BMDCs (10:1) which were previously pulsed with lysed tumor cells. 5 d later, sorted (nonpulsed) CD45+CD11c+ DCs from the DLNs or tumors (tumor-infiltrating DCs; TIDCs) were co-cultured with the tumor-specific CD3+ T cells, after CFSE labeling (10:1). Right, percentage of proliferated T cells which were cultured with sorted DCs from the DLN of mice with advanced tumors or animals with primordial tumors (early; received adenovirus 7 d before) or DCs from advanced tumors (B). (C) ELISPOT analysis of the responses induced by CD45+CD11c+ DCs, sorted from the spleens of early and advanced tumor-bearing mice, and directly incubated with tumor-reactive T cells, obtained as in A. (D) Tumor-specific CD3+ T cells were obtained as in A, and then added to culture wells, which contained tumor pulsed BMDCs (1:1). Either sorted CD45+CD11c+CD11b+/− DCs or unpulsed BMDCs were added to these cultures making a 1:1:1 ratio (T cell/pulsed BMDC/sorted DC/BMDC). (E) Left, proliferation indices of T cells in response to the addition of tumor infiltrating DCs (TIDCs) or BMDCs. Right, representative histogram of CFSE dye dilution. (F) Left, proliferation indices of T cells in response to the addition of BMDCs or DLN DCs sorted from mice with early or advanced tumors. Right, representative histogram of CFSE dilution. n = 4 mice/group. BMDC cultures were done in quad- or quintuplicate. Even stronger differences were obtained using all tumor-pulsed BMDCs (not depicted). Error bars, SEM. Data points on scatter plots represent experimental replicates for pooled DLN or tumors. Horizontal bars, SEM. *, P < 0.05. Representative of at least two independent experiments in all panels (n = 3–4 mice/group).
Figure 7.
Figure 7.
Tumor-infiltrating DCs exhibit a tolerogenic phenotype. (A) Mean fluorescent intensity (MFI) of CD40, MHCII, and PD-L1 on CD45+CD11c+ DCs from early (ovaries 7 d after adenovirus injection) or advanced tumor masses (n = 4/group). (B) Arginase activity of CD45+CD11c+ cells sorted from advanced dissociated tumors and spleens of p53/K-ras animals (performed in quadruplets). (C) CD45+CD14CD20CD3CD11c+Dec205+ cells from three separate advanced human tumors cultured with PBS or αCD40 and poly(I:C) for 24 h. Experiments were performed in duplicate. Error bars, SEM. *, P < 0.05. Representatives of two independent experiments are shown.
Figure 8.
Figure 8.
Distinct populations of DCs promote immunosurveillance and the escape phase of tumor development. (A) FACS analysis of dissociated ovaries from mice reconstituted with ITGAX-DTR-GFP or WT BM, 24 h after the i.p. administration of 6 ng/kg of diphtheria toxin. (B) Proportion of p53/K-ras mice reconstituted with BM from ITGAX-DTR-GFP mice without palpable tumors at the indicated times after administration of 6 ng/g of diphtheria toxin (DT) or PBS, 1 d before adenoviral injection (n = 6mice/group). (C) p53/K-ras mice were reconstituted with BM from ITGAX-DTR-GFP mice, and DCs were depleted with one dose of 6 ng/kg of diphtheria toxin (DT) at days 7 (n = 6 mice/group, top), or 31 (n = 10/group, bottom; two pooled independent experiments) after intrabursal adenovirus-Cre. PBS (n = 10/group; two pooled independent experiments) was administered to control mice. (D) Representative size of advanced ovarian tumors in mice depleted of DCs at early versus advanced stages, compared with the absence of DC depletion (PBS). Error bars, SEM. *, P < 0.05; **, P < 0.01. (E) ITGAX-DTR (DT) or WT mice (n = 3/group) were inoculated intrabursally with 2.5 × 10⁷ plaque-forming units of adenovirus expressing Red-Cherry, and red fluorescence was detected 4 d later. ITGAX-DTR mice received diphtheria toxin (6 ng/g body weight) 24 h before surgery. Brightness, contrast and color balance were uniformly adjusted in whole individual images. Bars, 100 µm. (F) Day 50 tumor growth in p53/Kras mice challenged with adenovirus-Cre and receiving i.p. PBS or diphtheria toxin (DT) 7 d later. Shown are representatives of four mice/group.
Figure 9.
Figure 9.
Tumor cell–derived PGE2 and TGF-β1 promote the immunosuppressive activity of DCs. (A) Quantification of PGE2, mature TGF-β1, and IL-6 in media conditioned by tumor cells from advanced (∼60 d) ovarian cancer specimens, in the presence or the absence of specific neutralizing antibodies. +BMDCs, BMDCs were incubated for 2 d in tumor-conditioned media before cytokine quantification; cRPMI, RPMI control media; TCmedia, tumor-conditioned media plus an irrelevant IgG; TCmedia+NeuAb, tumor-conditioned media plus specific neutralizing antibodies. Error bars, SEM. *, P < 0.05. (B) PD-L1 expression in splenic CD45+CD11c+MHC-II+ DCs sorted from mice carrying early (day 7) tumor lesions, cultured with control versus tumor-conditioned media, in the presence or the absence of specific neutralizing antibodies. (C) Splenic DCs (spDCs) sorted from early tumor-bearing mice were cultured for 48 h in RPMI or tumor-conditioned media (TCMed), in the presence of neutralizing anti-PGE2 or anti–TGF-β1 antibodies (NeuAb), or an irrelevant IgG. These cultured DCs were then incubated with tumor-pulsed BMDCs plus CFSE-labeled tumor-reactive T cells, obtained as in Fig. 6 A (1:1:1 ratio). Unpulsed BMDCs were added to control wells. The panel shows representative histograms of the proliferation of tumor-reactive T cells under different conditions. Representatives of two independent experiments are shown.

Comment in

Similar articles

Cited by

References

    1. Bell D., Berchuck A., Birrer M., Chien J., Cramer D.W., Dao F., Dhir R., Disaia P., Gabra H., Glenn P., et al. ; Cancer Genome Atlas Research Network 2011. Integrated genomic analyses of ovarian carcinoma. Nature. 474:609–615 10.1038/nature10166 - DOI - PMC - PubMed
    1. Bernardini M.Q., Baba T., Lee P.S., Barnett J.C., Sfakianos G.P., Secord A.A., Murphy S.K., Iversen E., Marks J.R., Berchuck A. 2010. Expression signatures of TP53 mutations in serous ovarian cancers. BMC Cancer. 10:237 10.1186/1471-2407-10-237 - DOI - PMC - PubMed
    1. Clark C.E., Hingorani S.R., Mick R., Combs C., Tuveson D.A., Vonderheide R.H. 2007. Dynamics of the immune reaction to pancreatic cancer from inception to invasion. Cancer Res. 67:9518–9527 10.1158/0008-5472.CAN-07-0175 - DOI - PubMed
    1. Connolly D.C., Bao R., Nikitin A.Y., Stephens K.C., Poole T.W., Hua X., Harris S.S., Vanderhyden B.C., Hamilton T.C. 2003. Female mice chimeric for expression of the simian virus 40 TAg under control of the MISIIR promoter develop epithelial ovarian cancer. Cancer Res. 63:1389–1397 - PubMed
    1. Dinulescu D.M., Ince T.A., Quade B.J., Shafer S.A., Crowley D., Jacks T. 2005. Role of K-ras and Pten in the development of mouse models of endometriosis and endometrioid ovarian cancer. Nat. Med. 11:63–70 10.1038/nm1173 - DOI - PubMed

Publication types

MeSH terms