. 2012 Mar 12;209(3):437-44.
doi: 10.1084/jem.20111923. Epub 2012 Feb 20.

Gamma secretase inhibition promotes hypoxic necrosis in mouse pancreatic ductal adenocarcinoma

Affiliations

Gamma secretase inhibition promotes hypoxic necrosis in mouse pancreatic ductal adenocarcinoma

Natalie Cook et al. J Exp Med. .

Abstract

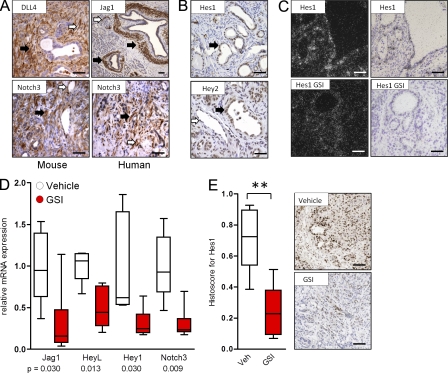
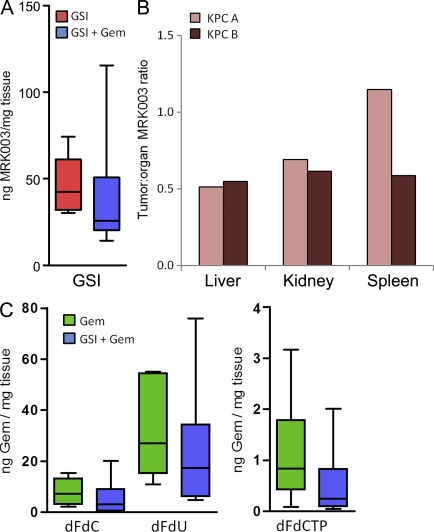
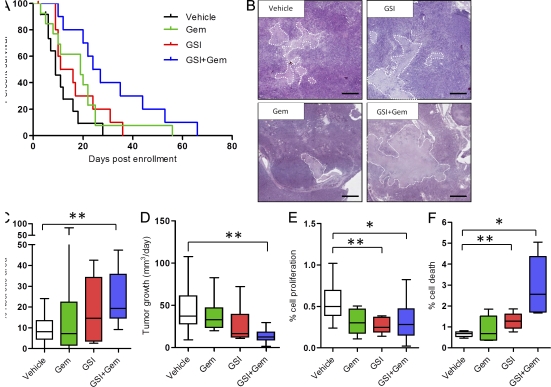
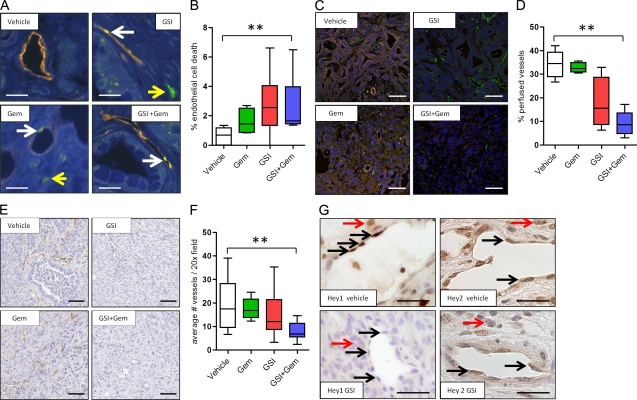
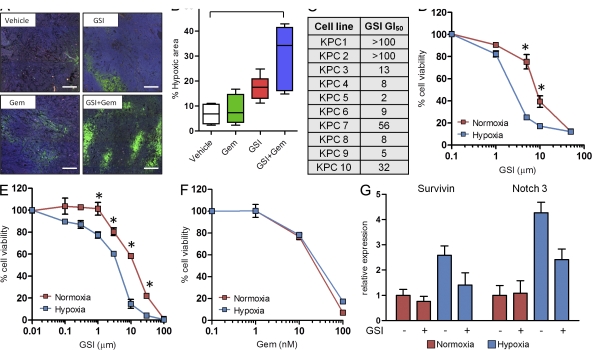
Pancreatic ductal adenocarcinoma (PDA) is a highly lethal disease that is refractory to medical intervention. Notch pathway antagonism has been shown to prevent pancreatic preneoplasia progression in mouse models, but potential benefits in the setting of an established PDA tumor have not been established. We demonstrate that the gamma secretase inhibitor MRK003 effectively inhibits intratumoral Notch signaling in the KPC mouse model of advanced PDA. Although MRK003 monotherapy fails to extend the lifespan of KPC mice, the combination of MRK003 with the chemotherapeutic gemcitabine prolongs survival. Combination treatment kills tumor endothelial cells and synergistically promotes widespread hypoxic necrosis. These results indicate that the paucivascular nature of PDA can be exploited as a therapeutic vulnerability, and the dual targeting of the tumor endothelium and neoplastic cells by gamma secretase inhibition constitutes a rationale for clinical translation.


Figures

Figure 1.
Figure 1.
Notch pathway components are expressed in human and mouse PDA and can be decreased by MRK003. (A) Expression of Notch ligands (DLL4 and Jagged1) and receptor (Notch 3) in mouse (left) and human (right) pancreatic cancer specimens (n = 5 examined). In addition to the expression in PDA neoplastic cells, note expression in endothelial (white arrows) and stromal cells (black arrows). (B) Expression of Notch target genes Hes1 and Hey2 in mouse PanIN and PDA tissue (neoplastic cells marked by black arrows). Hey2 expression is also noted in intratumoral endothelial cells (white arrow; n = 5). (C) In situ hybridization in dark and light fields demonstrating Hes1 expression in pancreatic cancer ductal cells and decreased Hes1 expression upon treatment with MRK003 (GSI; n = 3). (D) Quantitative real-time PCR showing relative mRNA expression of Notch pathway components in PDA tissue from mice treated with vehicle (n = 5) or MRK003 (n = 6) for 10 d. (E) Expression of Hes1 protein in tumors of mice treated with vehicle (n = 8) or GSI (n = 6; **, P = 0.003). Representative images from GSI treated and untreated tumors are shown to the right. Error bars represent SEM. Bars, 100 µm.
Figure 2.
Figure 2.
Intratumoral measurements of MRK003 and gemcitabine and tumor volumes. (A) Concentration of MRK003 in PDA tissue after monotherapy (n = 6) and GSI/gemcitabine combination treatment (n = 6; P = 0.18). (B) Ratio of MRK003 in other organs compared with the amount in a tumor in two different mice. (C) Concentration of gemcitabine and its metabolites in whole tumor samples (n = 6 on all cohorts). All animals were treated for 10 d then sacrificed 1 h after the last dose of gemcitabine and 6 h after the last dose of MRK003. Error bars represent SEM.
Figure 3.
Figure 3.
Combination treatment with MRK003 and Gemcitabine prolongs survival in PDA. (A) Survival is extended by the combination treatment of GSI and Gemcitabine (median survival vehicle 9 d vs. 26 d with GSI and gemcitabine; P = 0.002; n = 11 vehicle [black], n = 12 gemcitabine [green], n = 10 GSI [red], n = 10 GSI and gemcitabine [blue]). (B) Histological representative tumor appearances for each of the cohorts of animals treated in the survival study (bars, 200 µm). Necrotic areas are outlined. (C) Quantification of necrosis in the survival study (**, P = 0.003; n = 11 vehicle, n = 10 gemcitabine, n = 7 GSI, n = 9 GSI + gemcitabine). (D) Quantification of tumor volume growth using twice weekly high resolution ultrasound (**, P = 0.002; n = 10 in all cohorts). (E) Computer-based quantification of proliferation (phospho-histone histone H3) in tumors from mice treated for 10 d (**, P = 0.005; GSI n = 5, vehicle n = 10; *, P = 0.07; GSI + gemcitabine n = 6, vehicle n = 10). (F) Computer-based quantification of apoptosis in tumors from mice treated for 10 d (*, P = 0.008). Combination treatment (n = 6) group compared with vehicle (n = 5; **, P = 0.02), gemcitabine (n = 6), and GSI alone (n = 6; *, P = 0.01, GSI compared with vehicle). Error bars represent SEM.
Figure 4.
Figure 4.
The combination of MRK003 and gemcitabine synergistically kills intratumoral endothelial cells to decrease vascular function and density in PDA. (A) Representative immunofluorescence images of DAPI (blue), Meca32 (orange), and Cleaved caspase 3 (CC3; green) content in each of the 3 d–treated cohorts (n = 3 or more samples evaluated for each cohort). White arrows: CC3-positive endothelial cells; yellow arrow: CC3-positive nonendothelial cell. Bars, 10 µm. (B) Percentage of CC3-positive Meca32-expressing endothelial cells in tumor samples treated for 3 d (**, P = 0.008). Vehicle, n = 5; gemcitabine, n = 4; GSI, n = 6; GSI and gemcitabine, n = 6. (C) Representative immunofluorescence images of DAPI (blue), Meca32 (green), and Lectin (red) content in each of the 3 d–treated cohorts (bars, 50 µm; n = 3 or more samples evaluated for each cohort). (D) Quantification of vascular patency (percentage of lectin and meca32 positive endothelial cells) in the GSI/gemcitabine combination treatment (n = 5) compared with vehicle (n = 5; **, P = 0.008) or gemcitabine (n = 3; P = 0.004) GSI (n = 4; P = 0.06) compared with vehicle. (E) Histological representative Meca32 IHC-stained images for each of the cohorts of animals treated for 10 d. Bars, 50 µm. (F) Quantification of MVD in 3 d cohorts reveals a significant decrease in MVD in the GSI/gemcitabine combination treatment (n = 4) cohort compared with the gemcitabine (n = 4; P = 0.03), GSI (n = 4; P = 0.03), and vehicle (n = 8; **, P = 0.02) cohorts. All animals were sacrificed 1 h after the last dose of gemcitabine and 6 h after the last dose of the GSI. (G) Expression of Hey1 and Hey2 protein in the tumor endothelial cells of mice treated with vehicle or GSI. Black arrows: positive endothelial nuclei; red arrows: positive nonendothelial KPC tumor nuclei. Bars, 10 µm. n = 3 for each cohort. Error bars represent SEM.
Figure 5.
Figure 5.
Treatment-induced hypoxia acutely sensitizes tumor cells to MRK003. (A) Representative immunofluorescence images of pimonidazole hydrochloride (Hypoxyprobe-1) staining with areas of hypoxia shown in bright green after 3 d of treatment (bars, 100 µm; n = 4 or more samples evaluated for each condition). (B) Levels of hypoxia in tumors treated with the combination treatment (n = 6) compared with vehicle (n = 4; **, P = 0.006) and gemcitabine (n = 4; P = 0.02) cohorts. Combination treatment was compared with GSI (n = 6; P = 0.07). GSI treatment was compared with vehicle (P = 0.01). (C) A panel of 10 KPC cell lines were tested to determine the GI50 values when treated with GSI under normoxia (units = µM). (D) KPC cell lines were examined for effects of GSI under normoxic and hypoxic conditions. The graph shown is representative of 10 cell lines. These experiments were performed in triplicate on three separate occasions (*, P < 0.001). (E) Human PDA cells were examined for effects of GSI under normoxic and hypoxic conditions. The graph shown is representative of the HPAF cell line. This experiment was performed in triplicate on two separate occasions (*, P < 0.001). (F) KPC cell lines were examined for the cytotoxic activity of gemcitabine under normoxic and hypoxic conditions. (G) qRT-PCR of survivin and Notch3 under hypoxia, and after incubation with MRK003. Error bars represent SEM.

References

    1. Bapiro T.E., Richards F.M., Goldgraben M.A., Olive K.P., Madhu B., Frese K.K., Cook N., Jacobetz M.A., Smith D.M., Tuveson D.A., et al. 2011. A novel method for quantification of gemcitabine and its metabolites 2′,2′-difluorodeoxyuridine and gemcitabine triphosphate in tumour tissue by LC-MS/MS: comparison with (19)F NMR spectroscopy. Cancer Chemother. Pharmacol. 68:1243–1253 10.1007/s00280-011-1613-0 - DOI - PMC - PubMed
    1. Beatty G.L., Chiorean E.G., Fishman M.P., Saboury B., Teitelbaum U.R., Sun W., Huhn R.D., Song W., Li D., Sharp L.L., et al. 2011. CD40 agonists alter tumor stroma and show efficacy against pancreatic carcinoma in mice and humans. Science. 331:1612–1616 10.1126/science.1198443 - DOI - PMC - PubMed
    1. Bray S., Bernard F. 2010. Notch targets and their regulation. Curr. Top. Dev. Biol. 92:253–275 10.1016/S0070-2153(10)92008-5 - DOI - PubMed
    1. Burris H.A., III, Moore M.J., Andersen J., Green M.R., Rothenberg M.L., Modiano M.R., Cripps M.C., Portenoy R.K., Storniolo A.M., Tarassoff P., et al. 1997. Improvements in survival and clinical benefit with gemcitabine as first-line therapy for patients with advanced pancreas cancer: a randomized trial. J. Clin. Oncol. 15:2403–2413 - PubMed
    1. Chen Y.Q., Zhao C.L., Li W. 2009. Effect of hypoxia-inducible factor-1alpha on transcription of survivin in non-small cell lung cancer. J. Exp. Clin. Cancer Res. 28:29 10.1186/1756-9966-28-29 - DOI - PMC - PubMed

Publication types

MeSH terms