. 2012 Apr 1;188(7):3208-16.
doi: 10.4049/jimmunol.1103316. Epub 2012 Feb 20.

Bone marrow-derived IL-13Rα1-positive thymic progenitors are restricted to the myeloid lineage

Affiliations

Bone marrow-derived IL-13Rα1-positive thymic progenitors are restricted to the myeloid lineage

Cara L Haymaker et al. J Immunol. .

Abstract

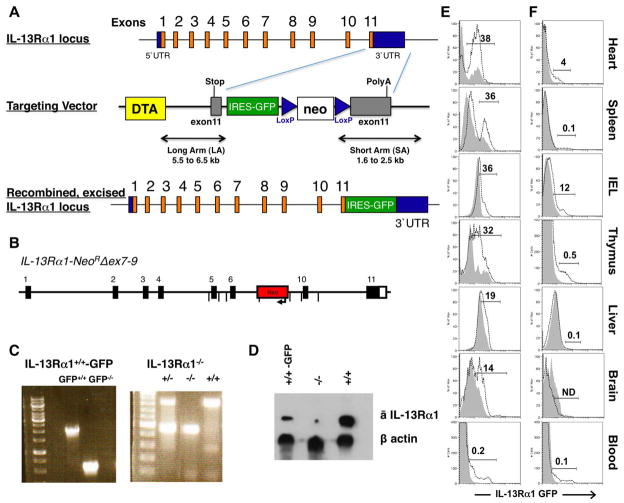
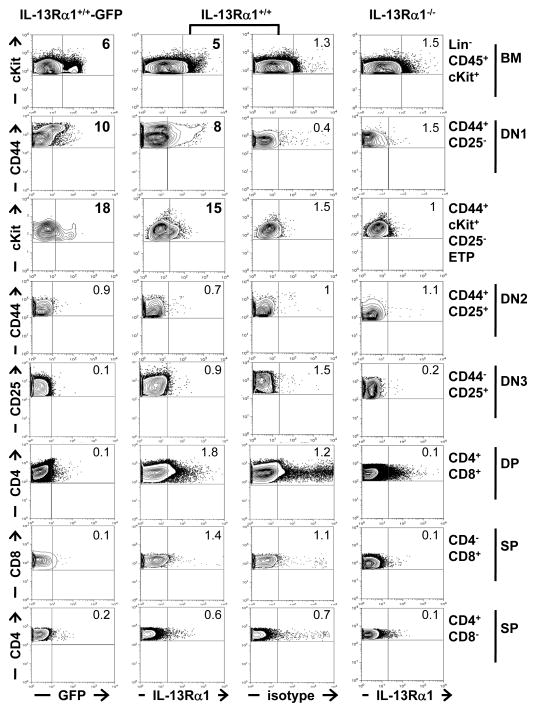
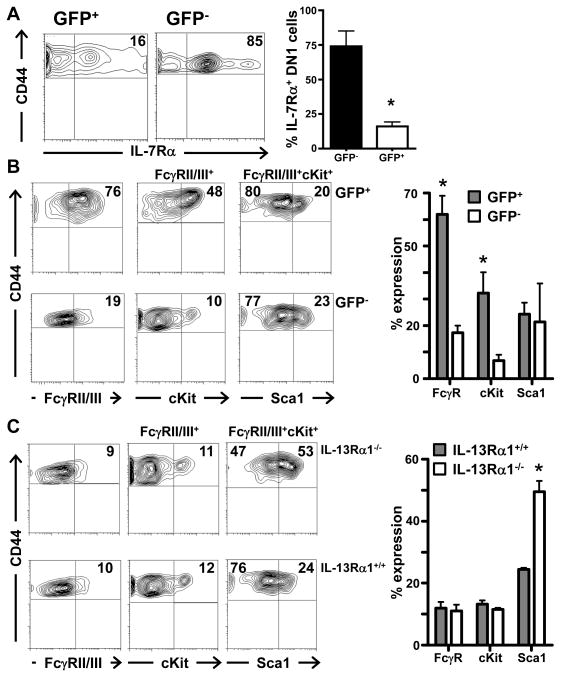
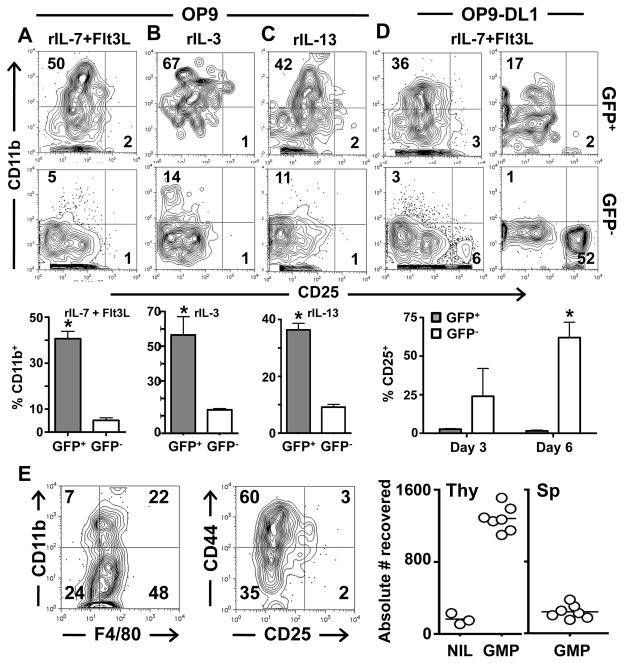
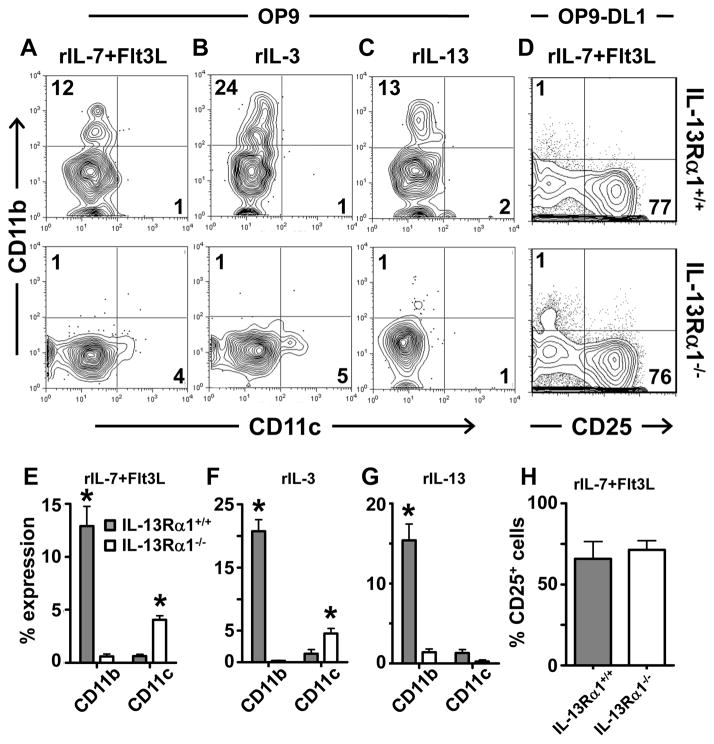
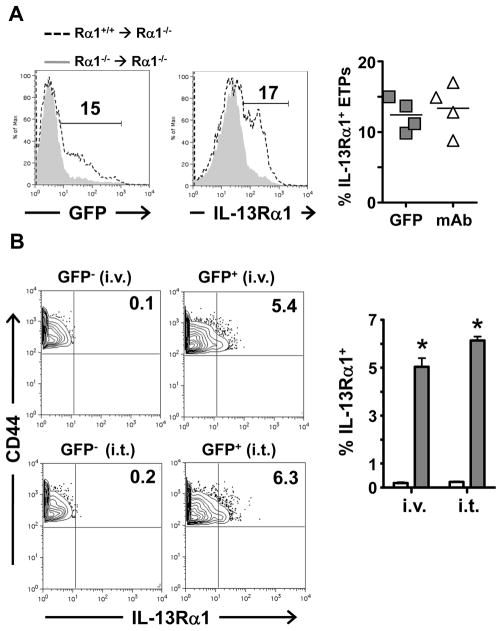
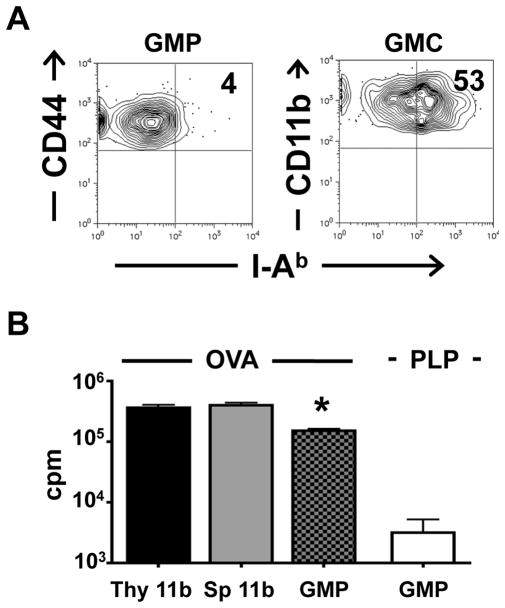
The earliest thymic progenitors (ETPs) were recently shown to give rise to both lymphoid and myeloid cells. Whereas the majority of ETPs are derived from IL-7Rα-positive cells and give rise exclusively to T cells, the origin of the myeloid cells remains undefined. In this study, we show both in vitro and in vivo that IL-13Rα1(+) ETPs yield myeloid cells with no potential for maturation into T cells, whereas IL-13Rα1(-) ETPs lack myeloid potential. Moreover, transfer of lineage-negative IL-13Rα1(+) bone marrow stem cells into IL-13Rα1-deficient mice reconstituted thymic IL-13Rα1(+) myeloid ETPs. Myeloid cells or macrophages in the thymus are regarded as phagocytic cells whose function is to clear apoptotic debris generated during T cell development. However, the myeloid cells derived from IL-13Rα1(+) ETPs were found to perform Ag-presenting functions. Thus, IL-13Rα1 defines a new class of myeloid restricted ETPs yielding APCs that could contribute to development of T cells and the control of immunity and autoimmunity.


Figures

Figure 1
Figure 1. Generation of IL-13Rα1-IRES-GFP and IL-13Rα1−/− mouse strains
IL-13Rα1-IRES-GFP (IL-13Rα1+/+-GFP) and IL-13Rα1-deficient (IL-13Rα1−/−) mice were generated as described in materials and methods. (A) The top panel shows a schematic representation of the IL-13Rα1 locus. The targeting vector incorporates the diphtheria toxin A negative selection marker (DTA), the IRES-GFP cassette and the positive selection neomycin (neo) cassette flanked by loxP sites. The bottom construct depicts the IL-13Rα1 locus with the IRES-GFP gene incorporated at the end of exon 11. (B) the IL-13Rα1-NeoRΔex7–9 representation shows replacement of the transmembrane exons 7, 8, and 9 by the neomycin gene. (C) shows PCR analysis of the IL-13Rα1+/+-GFP (GFP+/+) and IL-13Rα1+/+ (GFP−/−) with a 2,029 and 578 bp band, respectively (left panel). The median panel shows PCR bands for heterozygous IL-13Rα1+/− mice (828 and 466 bp), homozygous IL-13Rα1−/− (466bp) and wild type IL-13Rα1+/+ (828 bp). D, shows expression of IL-13Rα1 in thymic cells from IL-13Rα1−/− (−/−), IL-13Rα1+/+-GFP (+/+-GFP) and IL-13Rα1+/+ wild-type C57BL/6 mice (+/+) as determined by western blot using an anti-IL-13Rα1 antibody. (E and F) cells were harvested from the heart, spleen, intra-epithelial layer of the small intestine (IEL), thymus, liver, brain, and peripheral blood of IL-13Rα1+/+ (solid line) and IL-13Rα1+/+-GFP (dotted line) mice and analyzed for expression of IL-13Rα1 by GFP. Dead cells were excluded by 7AAD. Large and granular (E) and small (F) cells were gated based upon forward and side-scatter parameters. GFP expression is depicted by histogram. The data is representative of 3 independent experiments with an N=2 per experiment. The numbers represent the percent GFP-positive cells (GFP+) among the total population based on the GFP population. ND, not detected.
Figure 2
Figure 2. IL-13Rα1 is expressed on bone marrow and thymic progenitors
Thymic and bone marrow cells (depleted of Lin+ cells) from IL-13Rα1+/+-GFP, IL-13Rα1+/+ and IL-13Rα1−/− mice were stained with antibodies to CD4, CD8, CD25, CD44, cKit, and CD45 and analyzed for IL-13Rα1 expression by GFP (column 1) or staining with anti-IL-13Rα1 monoclonal antibody (column 2 and 4). Column 3 shows staining with isotype control for anti-IL-13Rα1 antibody. IL-13Rα1 expression was analyzed on the gated bone marrow (row 1) and thymic (rows 2–8) cells as indicated on the right of each row. The numbers indicate percent expression of IL-13Rα1 for each group. The data is representative of 7 individual mice. See also Figure S1.
Figure 3
Figure 3. IL-13Rα1+ DN1 cells manifest a GMP phenotype
Thymocytes from IL-13Rα1+/+-GFP mice were stained with anti-CD44 and anti-CD25 antibodies. (A) the cells were also stained with anti-IL-7Rα antibody and receptor expression was analyzed on GFP+CD44+CD25 and GFPCD44+CD25 cells. The contour plots show the results of a representative IL-7Rα expression experiment while the right panel shows the mean percent ± SD of IL-7Rα expression compiled from 6 separate experiments. *indicates statistical significance by Student’s t test. (B) the cells were also stained with anti-FcγRII/III, anti-cKit, and anti-Sca1 antibodies and the GFP+CD44+CD25 (GFP+) and GFPCD44+CD25 (GFP) cells were analyzed for expression of FcγRII/III (left panel), and the FcγRII/III+ cells were assessed for cKit (median panel) and those positive for FcγRII/III/cKit were analyzed for Sca1 expression (right panel). (C) thymocytes from IL-13Rα1+/+ and IL-13Rα1−/− mice were stained with anti-CD44, anti-CD25, anti-FcγRII/III, anti-cKit, and anti-Sca1 antibodies. CD44+CD25 cells were sequentially analyzed for expression of FcγRII/III (left panel), cKit (middle panel), and Sca1 (right panel) as in (B). The numbers indicate percent expression for each marker. In (B and C) the plots are representative experiments. The graphs to the right of B and C show the mean percent ± SD expression for each marker compiled from separate experiments. *indicates statistical significance by two-tailed, unpaired Student’s t test. P values are indicated in the text.
Figure 4
Figure 4. IL-13Rα1+ early thymic progenitors mature into myeloid but not lymphoid cells
GFPCD44+CD25cKit+ (GFP) and GFP+CD44+CD25cKit+ (GFP+) ETPs were cultured on OP9 stroma for 3 days with (A) rIL-7 and Flt3L, (B) rIL-3, or (C) rIL-13. (D) the cells were cultured on OP9-DL1 stroma for 3 (left panel) or 6 (right panel) days with rIL-7 and Flt3L. The cultures were stained for CD45, 7AAD, CD11b and CD25 markers. The numbers represent the percent expression of CD25 and CD11b on CD45+7AAD cells. The contour plots are representative of 6 independent experiments. The graphs show the mean percent ± SD expression for each marker. * indicates statistical significance by two-tailed, unpaired Student’s t test. P values are indicated in the text. (E) GFP+CD44+CD25cKit+ cells from CD45.2+ IL-13Rα1+/+-GFP mice were injected intrathymically into CD45.1 IL-13Rα1+/+ mice (10,000 cells per mouse) and the CD45.2+GFP+ thymic cells were analyzed for expression of CD11b and F4/80 (left contour plot) and CD44 and CD25 (right contour plot). CD45.2+GFP+ cells were quantified in the thymus (Thy) and spleen (Sp) of mice recipient of GMPs or NIL (suspension media with no GMPs) (right panels). The numbers indicate percent expression of the indicated marker on CD45.2+GFP+ cells. The data are representative of 5 independent experiments with the graph representing individual recipient mice.
Figure 5
Figure 5. IL-13Rα1−/− early thymic progenitors do not mature into CD11b+ cells
ETPs(CD44+CD25cKit+) were sorted from the thymus of IL-13Rα1−/− and IL-13Rα1+/+ mice and cultured on OP9 (A–C) or OP9-DL1 (D) cells for 3 days in the presence of rIL-7+Flt3L (A, D), rIL-3 (B), or rIL-13 (C). Subsequently, cells were stained for CD45, 7AAD, CD11b, CD25, and CD11c. Contour plots are representative of 3 independent experiments. The numbers indicate percent expression within the CD45+7AAD population. (E, F, G, and H) show the mean percent ± SD expression for the markers analyzed in (A, B, C, and D), respectively. * indicates statistical significance by two-tailed, unpaired Student’s t test. P values are indicated in the text.
Figure 6
Figure 6. IL-13Rα1+ progenitors arrive in the thymus pre-committed
(A) Bone marrow chimeras were generated by i.v. transfer of 10 × 106 Lin bone marrow cells from IL-13Rα1+/+-GFP (Rα1+/+) or IL-13Rα1−/− (Rα1−/−) mice into lethally irradiated IL-13Rα1−/−mice and 7 days later the Rα1+/+→Rα1−/− and Rα1−/−→Rα1−/− chimeras were analyzed for IL-13Rα1 expression on the thymic ETP (CD44+CD25cKit+) population by GFP (left histogram) and anti-IL-13Rα1 antibody (right histogram). The numbers represent percent expression among the CD44+CD25cKit+ cells. The right scatter plot shows percent IL-13Rα1+CD44+CD25cKit+ cells for individual experiments. (B) CD44+CD25cKit+GFP (GFP) and CD44+CD25cKit+GFP+ (GFP+) ETP cells were sorted from the thymus of IL-13Rα1+/+-GFP CD45.2 mice. Cells (15,000 per mouse) were injected i.v. or i.t. into CD45.1 mice and six days later the cells were collected and analyzed for expression of IL-13Rα1 by GFP. The contour plots show results of a representative experiment. The numbers represent percent expression among the CD44+CD25cKit+CD45.2+ population. The bar graph show the mean percent ± SD expression for IL-13Rα1 expression compiled from 4 experiments. *indicates statistical significance by two-tailed, unpaired Student’s t test. P values are indicated in the text. See also Figure S2 and Figure S3.
Figure 7
Figure 7. IL-13Rα1+ ETP-derived thymic myeloid cells function as presenting cells
(A) I-Ab expression was analyzed on GFP+CD44+CD25cKit+ (GMP) as well as mature GFP+-CD11b myeloid cells (GMC). Data is representative of 4 independent experiments. (B) differentiated GFP+ cells (GMP) were cultured (1×10⁴ cells/well) with OT-II T cells (2×10⁵ cells/well) and 20μg/ml OVA or control PLP protein for 48h. CD11b+-sorted thymic (Thy 11b) and splenic (Sp 11b) myeloid cells were used as controls. 1μCi [3H]thymidine was added to each well for the last 14.5h of culture. Each bar represents the mean ± SD of triplicate wells. The data is representative of 3 independent experiments. *indicates statistical significance using one-way ANOVA (p<0.0001) when compared to GMP stimulated with the negative control PLP.

Similar articles

Cited by

References

    1. Godfrey DI, Kennedy J, Suda T, Zlotnik A. A developmental pathway involving four phenotypically and functionally distinct subsets of CD3-CD4-CD8- triple-negative adult mouse thymocytes defined by CD44 and CD25 expression. J Immunol. 1993;150:4244–4252. - PubMed
    1. von Boehmer H. Positive selection of lymphocytes. Cell. 1994;76:219–228. - PubMed
    1. Benz C, V, Martins C, Radtke F, Bleul CC. The stream of precursors that colonizes the thymus proceeds selectively through the early T lineage precursor stage of T cell development. J Exp Med. 2008;205:1187–1199. - PMC - PubMed
    1. Matsuzaki Y, Gyotoku J, Ogawa M, Nishikawa S, Katsura Y, Gachelin G, Nakauchi H. Characterization of c-kit positive intrathymic stem cells that are restricted to lymphoid differentiation. J Exp Med. 1993;178:1283–1292. - PMC - PubMed
    1. Godfrey DI, Zlotnik A, Suda T. Phenotypic and functional characterization of c-kit expression during intrathymic T cell development. J Immunol. 1992;149:2281–2285. - PubMed

Publication types

MeSH terms

Substances