. 2012 Jul;136(3):291-305.
doi: 10.1111/j.1365-2567.2012.03578.x.

IgG keeps virulent Salmonella from evading dendritic cell uptake

Affiliations

IgG keeps virulent Salmonella from evading dendritic cell uptake

Sebastián A Riquelme et al. Immunology. 2012 Jul.

Abstract

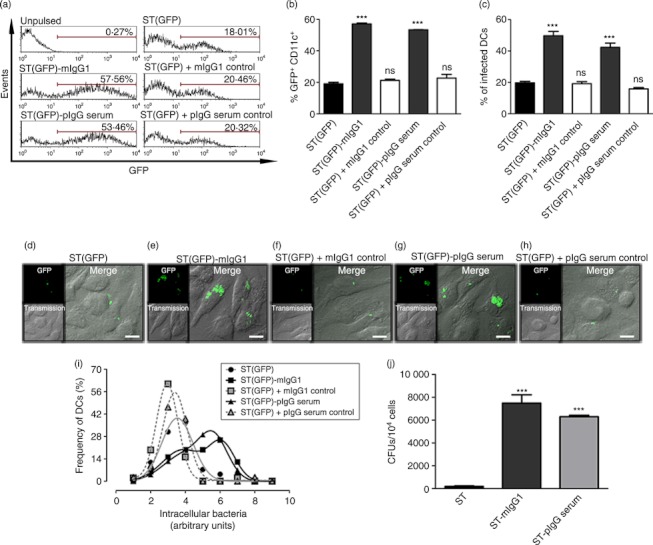
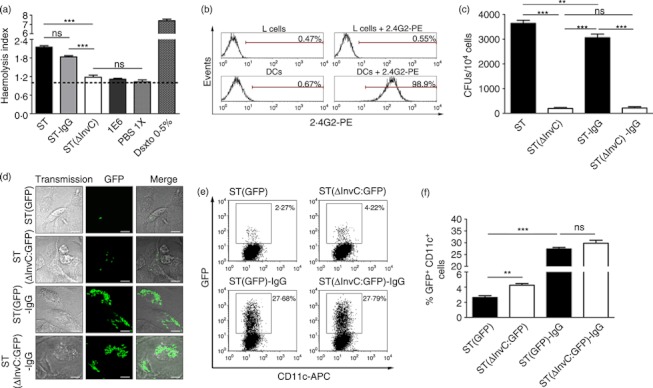
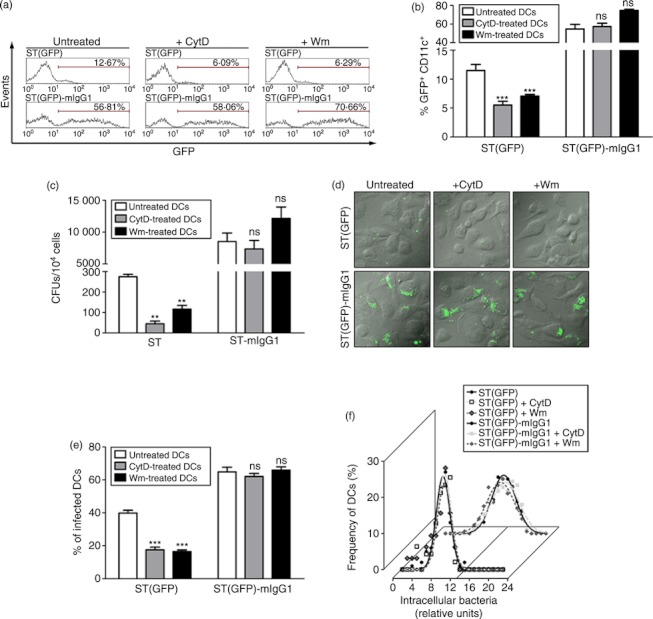
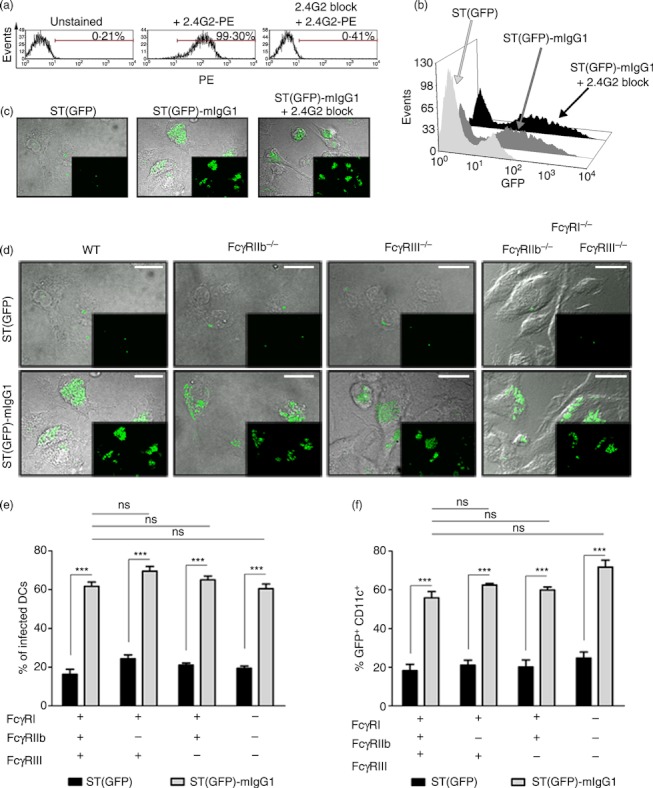
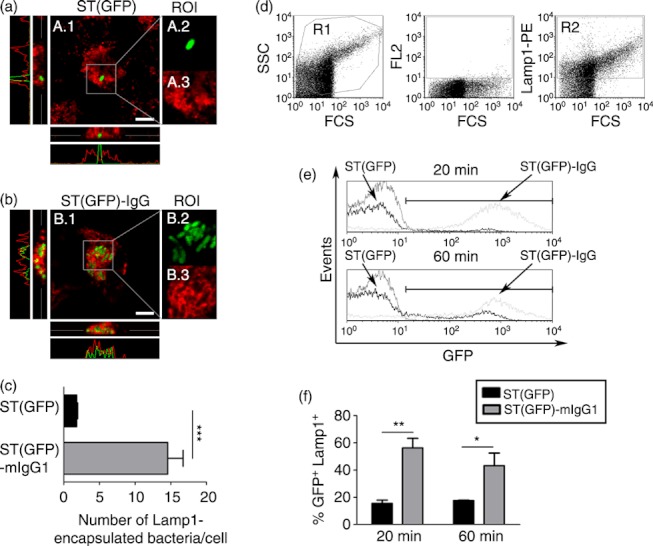
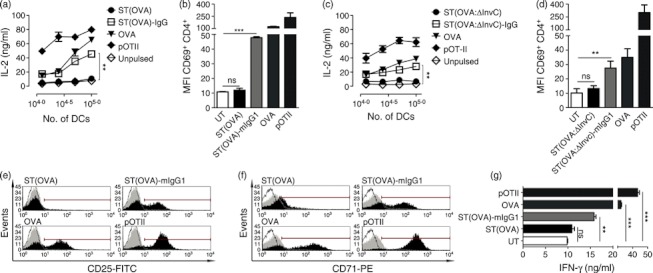
Dendritic cells (DCs) are phagocytic professional antigen-presenting cells that can prime naive T cells and initiate anti-bacterial immunity. However, several pathogenic bacteria have developed virulence mechanisms to impair DC function. For instance, Salmonella enterica serovar Typhimurium can prevent DCs from activating antigen-specific T cells. In addition, it has been described that the Salmonella Pathogenicity Island 1 (SPI-1), which promotes phagocytosis of bacteria in non-phagocytic cells, can suppress this process in DCs in a phosphatidylinositol 3-kinase (PI3K) -dependent manner. Both mechanisms allow Salmonella to evade host adaptive immunity. Recent studies have shown that IgG-opsonization of Salmonella can restore the capacity of DCs to present antigenic peptide-MHC complexes and prime T cells. Interestingly, T-cell activation requires Fcγ receptor III (FcγRIII) expression over the DC surface, suggesting that this receptor could counteract both antigen presentation and phagocytosis evasion by bacteria. We show that, despite IgG-coated Salmonella retaining its capacity to secrete anti-capture proteins, DCs are efficiently capable of engulfing a large number of IgG-coated bacteria. These results suggest that DCs employ another mechanism to engulf IgG-coated Salmonella, different from that used for free bacteria. In this context, we noted that DCs do not employ PI3K, actin cytoskeleton or dynamin to capture IgG-coated bacteria. Likewise, we observed that the capture is an FcγR-independent mechanism. Interestingly, these internalized bacteria were rapidly targeted for degradation within lysosomal compartments. Hence, our results suggest a novel mechanism in DCs that does not employ PI3K/actin cytoskeleton/dynamin/FcγRs to engulf IgG-coated Salmonella, is not affected by anti-capture SPI-1-derived effectors and enhances DC immunogenicity, bacterial degradation and antigen presentation.


Figures

Figure 1
Figure 1
IgG-opsonization increases Salmonella entry to dendritic cells (DCs). (a) DCs were pulsed for 60 min either with free Salmonella enterica serovar Typhimurium [ST(GFP)], Salmonella coated with mIgG1 [ST(GFP)-mIgG1] or Salmonella coated with polyclonal serum [ST(GFP)-pIgG Serum]. In addition, DCs were pulsed with Salmonella incubated with control mIgG1 and control pIgG Serum [‘ST(GFP) + mIgG1 Control’ and ‘ST(GFP) + pIgG Serum Control’, respectively]. Then, cells were treated with gentamicin for 1 hr, washed and stained with anti-CD11c antibody to be analysed by flow cytometry. Cells within the marker in each histogram represent GFP+ CD11c+ population. (b) Bar graphs representing the quantification of flow cytometry data. (c) Quantification of infected cells using confocal microscopy. (d–h) Confocal microscopy images of DCs treated as described in (a). (i) Gaussian distributions for the frequencies of DCs (%) and intracellular bacterial load (Relative Units) (for details see Data S1). The correlation index (R2) obtained for ST(GFP)-, ST(GFP)-mIgG1-, ST(GFP) + mIgG1 Control-, ST(GFP)-pIgG Serum and ST(GFP) + pIgG Serum Control-infected DCs were 0·9596, 0·9969, 0·9986, 0·9994 and 0·9881, respectively. (j) Gentamicin protection assays. Bar graphs showing that IgG-opsonization increases the amount of Salmonella intracellular colony-forming units (CFUs) within DCs. DCs were incubated either with free ST, ST-mIgG1 or ST-pIgG Serum at multiplicity of infection (MOI) 25 for 1 hr, extensively washed with PBS, and treated for an additional hour with 100 μg/ml gentamicin to kill extracellular bacteria. Then, 20 000 cells were lysed and a fraction was plated on agar plates. Data were analysed by one-way analysis of variance. Data shown are means ± SEM. Each bar represents the average of at least three independent experiments. ***P < 0·001; ns, non-significant. Scale bars = 10 μm.
Figure 2
Figure 2
IgG-opsonized Salmonella retains the capacity to secrete SPI-1 effectors. (a) Haemolysis of sheep red blood cells (SRBCs) challenged with Salmonella enterica serovar Typhimurium (ST), ST(ΔInvC) or ST-mIgG1 was monitored by measuring haemoglobin at 405 nm. The haemolytic index was calculated as the quotient between the released haemoglobin in each treatment over the spontaneous release of unpulsed SRBC. (b) L cells do not express low-affinity Fcγ receptors (FcγRs). Surface expression of low-affinity FcγRs (FcγRIIb and FcγRIII) was measured on L cells by staining with 2.4G2-phycoerythrin (PE). Dendritic cells (DCs) were included as a positive control for 2.4G2 staining. (c) Opsonized Salmonella remain capable of infecting non-phagocytic cells. L cells were challenged either with ST, ST(ΔInvC), ST-mIgG1 or ST(ΔInvC)-mIgG1 and then intracellular conlony-forming units (CFUs) were quantified in gentamicin protection assays. (d) IgG-opsonization increases Salmonella internalization by phagocytic cells. DCs were pulsed with ST, ST(ΔInvC), ST-mIgG1 or ST(ΔInvC)-mIgG1 and mounted for confocal microscopy. (e) SPI-1-derived effectors do not impair capture of IgG-opsonized Salmonella in DCs. Dot plots show amount of GFP+ CD11c+ cells. (f) Bar graphs resuming data of dot plots shown in (e). Data were analysed by analysis of variance. Data shown are means ± SEM of three independent experiments.*P < 0·05; ***P < 0·001; ns, non-significant.
Figure 3
Figure 3
Dendritic cells (DCs) use actin cytoskeleton and phosphatidyl inositol 3-kinase (PI3K) to internalize free but not IgG-opsonized Salmonella enterica serovar Typhimurium (ST). (a) Cytochalasin D (CytD) and wortmannin (Wm) do not prevent the uptake of IgG-opsonized Salmonella. Representative histograms from three independent experiments showing GFP-derived fluorescence of CD11c+ cells challenged either with ST(GFP) or ST(GFP)-mIgG1. Left, middle and right panels show control, CytD- and Wm-treated DCs, respectively. (b) Quantification of FACS data shown in (a). Each bar is the average of three independent experiments (white: control DCs; grey: CytD-treated DCs; black: Wm-treated DCs). (c) Control, CytD-treated or Wm-treated DCs were pulsed either with ST or ST-mIgG1 and then intracellular colony-forming units (CFUs) were quantified in gentamicin protection assays as described in the Materials and methods. (d) Confocal microscopy images of control, CytD-treated or Wm-treated DCs challenged with either ST(GFP) or ST(GFP)-mIgG1. Upper and lower panels show control, CytD-treated or Wm-treated DCs challenged with ST(GFP) or ST(GFP)-mIgG1, respectively. (e) Quantification of confocal microscopy data shown in (d). Bar graph shows the percentage of infected DCs per field. Each cell that contained at least a single bacterium was considered an infected DC. (f) Gaussian distribution showing the frequency of infected DCs (%) and intracellular bacterial loads. Bacterial areas were normalized by applying a base 10 logarithm. For control DCs infected with ST(GFP) correlation index (R), mean parameter and standard deviation (SD) were 0·9862, 9·501 and 1·437, respectively (lower black curve). For CytD-treated DCs infected with ST(GFP) correlation index (R), mean parameter and SD were 0·9461, 9·818 and 1·408, respectively (lower silver dotted curve). For Wm-treated DCs infected with ST(GFP) correlation index (R), mean parameter and SD were 0·9319, 9·790 and 1·464, respectively (lower grey dotted curve). For control DCs challenged with ST(GFP)-mIgG1 correlation index (R), mean parameter and SD were 0·9898, 13·20 and 2·508, respectively (upper black curve). For CytD-treated DCs challenged with ST(GFP)-mIgG1 correlation index (R), mean parameter and SD were 0·9898, 13·52 and 2·910, respectively (upper silver dotted curve). For Wm-treated DCs challenged with ST(GFP)-IgG correlation index (R), mean parameter and SD were 0·9658, 12·53 and 2·901, respectively (upper grey dotted curve). Data were analysed by Student’s t-test between either CytD-treated or Wm-treated DCs against control cells. Data shown are means ± SEM of three independent experiments. **P < 0·01, ***P < 0·001; ns: non-significant. Scale bars = 10μm.
Figure 4
Figure 4
Fcγ receptors (FcγRs) are not involved in the internalization of IgG-coated Salmonella enterica serovar Typhimurium (ST). (a) Blockade of low affinity FcγRs by 2.4G2 is highly effective. Cells were left untreated or incubated with 2.4G2 blocking antibody. Unblocked low-affinity FcγRs were immune-stained with 2.4G2-phycoerythrin (PE) and analysed by FACS. (b) Blockade of low-affinity FcγRs does not reduce the percentage of ST(GFP)-mIgG1-infected dendritic cells (DCs). (c) Blockade of low-affinity FcγRs does not decrease intracellular bacterial loads. (d) Wild-type (WT), FcγRIIb−/−, FcγRIII−/− or FcγRI−/− FcγRIIb−/− FcγRIII−/− DCs were pulsed either with ST(GFP) or ST(GFP)-mIgG1. Bacterial loads were detected by confocal microscopy. No significant differences in intracellular bacterial load were observed for DCs challenged with ST(GFP)-mIgG1, independently of the availability of FcγRs. (e) Quantification of data shown in (d). Data are percentages of either ST(GFP) or ST(GFP)-mIgG1-infected DCs per field. (f) FACS analyses for DCs challenged with either ST(GFP) or ST(GFP)-mIgG1. No significant differences were observed between WT and all FcγRs-deficient DCs. Two-way analysis of variance was employed to analyse different infections between cells. One-way analysis of variance was employed to compare ST(GFP)-mIgG1-infected cells with WT and FcγR-deficient cells. Data shown are means ± SEM of three independent experiments. ***P < 0·001; ns: non-significant. Scale bars = 20 μm.
Figure 5
Figure 5
Salmonella enterica serovar Typhimurium (ST) (GFP)-IgG are rapidly targeted to Lamp1+ compartments. Dendritic cells (DCs) were challenged either with free or mIgG1-coated ST(GFP). (a) A.1 shows an overlay between ST(GFP) and Lamp1 Alexa-Fluor 555 channels. A.2 and A.3 are amplifications of region of interest (ROI). A.2 shows the ST(GFP) channel. A.3 shows the Lamp1 AF-555 channel. Lower and left microscopy merge panel show the side-view of the analysed cell (Z-stack). Grey line represents the selected focal plane shown in A.1. Histograms show the absence of overlapping between green (GFP) and red (Lamp1) emissions in the selected focal panel. (b) B.1 shows an overlay between ST(GFP)-IgG and Lamp1 Alexa-Fluor 555 (AF-555) channels. B.2 and B.3 are an amplification of the arbitrary grey squared ROI. B.2 shows the ST(GFP)-IgG channel. B.3 shows the Lamp1 AF-555 channel. Lower and left microscopy merge panel show the side-view of the analysed cell (Z-stack). Co-localizations are shown as yellow. Grey line represents the selected focal plane shown in B.1. Histograms show the presence of overlapping between green (GFP) and red (Lamp1) emissions in the selected focal panel. (c) Quantification of either ST(GFP) or ST(GFP)-IgG Lamp1-encapsulated/co-localized on each Z-stack analysed. Extracellular bacteria were discriminated by Z-stack analyses. Black and grey bars are the number of Lamp1-encapsulated/co-localized ST(GFP) or ST(GFP)-IgG, respectively. More than 100 cells were analysed for each treatment. (d) To evaluate targeting of intracellular bacteria to degradative compartments, bacteria GFP expression was assessed in Lamp1+ vesicles and analysed by flow cytometry for DCs challenged either with ST(GFP) or ST(GFP)-IgG. Left panel shows forward–side scatter dot plot of recovered intracellular compartments. Middle panel shows a dot plot for the red channel (FL2) auto-fluorescence. Right panel shows a dot plot for the positive subset of Lamp1+ compartments (both gated on R1 for each treatment). Intracellular recovered compartments showed no significant differences between free and IgG-coated ST-infected cells (data not shown). (e) Histograms showing the percentage of Lamp1+ compartments containing either ST(GFP) or ST(GFP)-IgG at 20 and 60 min. Lamp1+ compartments from Salmonella-pulsed cells were used as auto-fluorescence. Events analysed were gated from R2. (f) Graphs represent the quantification of the data from histograms shown in (e). Each bar represents the percentage of Lamp1+ compartments containing GFP-expressing bacteria. Data shown are means ± SEM of three independent experiments. Data were analysed by Student’s t-test. ***P < 0·001;**P < 0·01; *P < 0·05. Scale bars = 10 μm.
Figure 6
Figure 6
IgG-opsonization restores antigen presentation of Salmonella enterica serovar Typhimurium (ST) -derived peptides. Dendritic cells (DCs) were pulsed either with ST(WT) (a, b, e–g) or ST(ΔInvC) (c, d) bacteria both expressing ovalbumin (OVA) as free or IgG-coated. Infection was carried out by 2 hr and cells were treated with gentamicin at 50 μg/ml for 12 hr. Then, different numbers of cells were co-cultured with 1 × 10⁵ OT-II cells (T CD4+). As a control, during co-culture, cells were pulsed with OVA protein or OT-II peptide (pOT-II). After 20 hr, supernatants were collected and analysed for interleukin-2 (IL-2) presence by ELISA. (a) IgG-opsonization of Salmonella-(OVA) restores the capacity of DCs to stimulate IL-2 secretion from OT-II cells. (b) IgG-opsonization of Salmonella-(OVA) restores activation/up-regulation of CD69 on OT II cells. (c) IgG-opsonization of Salmonella-(OVA;ΔInvC) restores the capacity of DCs to stimulate IL-2 secretion from OT-II cells. (d) IgG-opsonization of Salmonella-(OVA;ΔInvC) restores activation/up-regulation of CD69 on OT II cells. (e, f) IgG-opsonization of Salmonella-(OVA) trigger up-regulation on OT II cells of proliferation markers such as IL-2R (CD25) and Transferrin receptor (CD71), respectively. (g) IgG-opsonization of Salmonella-(OVA) restores the capacity of DCs to prime OT-II cells for secretion of interferon-γ (IFN-γ). Data shown are means ± SEM of three independent experiments. Data were analysed by analysis of variance. **P < 0·01 ***P < 0·001; ns: non-significant.

Similar articles

Cited by

References

    1. Banchereau J, Briere F, Caux C, Davoust J, Lebecque S, Liu YJ, Pulendran B, Palucka K. Immunobiology of dendritic cells. Annu Rev Immunol. 2000;18:767–811. - PubMed
    1. Ravetch JV. Fc receptors. Curr Opin Immunol. 1997;9:121–5. - PubMed
    1. Ravetch J. In vivo veritas: the surprising roles of Fc receptors in immunity. Nat Immunol. 2010;11:183–5. - PubMed
    1. Restifo NP, Bacik I, Irvine KR, et al. Antigen processing in vivo and the elicitation of primary CTL responses. J Immunol. 1995;154:4414–22. - PMC - PubMed
    1. Smith-Garvin JE, Koretzky GA, Jordan MS. T cell activation. Annu Rev Immunol. 2009;27:591–619. - PMC - PubMed

Publication types

MeSH terms