. 2012 May;53(5):807-16.
doi: 10.1111/j.1528-1167.2012.03417.x. Epub 2012 Feb 21.

Spatiotemporal neuronal correlates of seizure generation in focal epilepsy

Affiliations

Spatiotemporal neuronal correlates of seizure generation in focal epilepsy

Mark R Bower et al. Epilepsia. 2012 May.

Abstract

Purpose: Focal seizures are thought to reflect simultaneous activation of a large population of neurons within a discrete region of pathologic brain. Resective surgery targeting this focus is an effective treatment in carefully selected patients, but not all. Although in vivo recordings of single-neuron (i.e., "unit") activity in patients with epilepsy have a long history, no studies have examined long-term firing rates leading into seizures and the spatial relationship of unit activity with respect to the seizure-onset zone.

Methods: Microelectrode arrays recorded action potentials from neurons in mesial temporal structures (often including contralateral mesial temporal structures) in seven patients with mesial temporal lobe epilepsy.

Key findings: Only 7.6% of microelectrode recordings showed increased firing rates before seizure onset and only 32.4% of microelectrodes showed any seizure-related activity changes. Surprisingly, firing rates on the majority of microelectrodes (67.6%) did not change throughout the seizure, including some microelectrodes located within the seizure-onset zone. Furthermore, changes in firing rate before and at seizure onset were observed on microelectrodes located outside the seizure-onset zone and even in contralateral mesial temporal lobe. These early changes varied from seizure to seizure, demonstrating the heterogeneity of ensemble activity underlying the generation of focal seizures. Increased neuronal synchrony was primarily observed only following seizure onset.

Significance: These results suggest that cellular correlates of seizure initiation and sustained ictal discharge in mesial temporal lobe epilepsy involve a small subset of the neurons within and outside the seizure-onset zone. These results further suggest that the "epileptic ensemble or network" responsible for seizure generation are more complex and heterogeneous than previously thought and that future studies may find mechanistic insights and therapeutic treatments outside the clinical seizure-onset zone.


Conflict of interest statement

The authors have no conflicts of interest. We confirm that we have read the Journal’s position on issues involved in ethical publication and affirm that this report is consistent with those guidelines

Figures
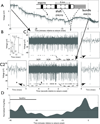
Figure 1
Figure 1
Long-duration, high-frequency recording of multi-unit activity (MUA) A) 50 min of continuous data recorded from a macro- and micro-electrodes (depth electrode schematic shown in inset, described in Worrell et al. 2008) in hippocampus beginning 45 min prior to seizure onset (“0”). The hybrid depth electrodes are composed of 4 or 8 clinical macroelectrodes (blue), 9 microwires (black) exiting the tip of the depth, and 18 microwires arranged between the clinical macroelectrodes along the depth electrode shaft. B) Action potentials were detected using a series of both relative and absolute thresholds in both voltage and time. Candidate action potentials had to satisfy each of the six criteria, or else they were rejected: a. peak > three standard deviations (“three sigma”), b. keep largest value, c. rise to peak > 1 sigma, d. fall from peak > 1. 5 sigma, e. peak-valley time between .03–.5 msec, f. |peak-valley| > 20 µV. C) Expanded view showing 5 seconds of filtered (600–10,000 Hz) microelectrode data (C1) 45 min prior to seizure onset with action potentials marked by “.” and an example shown at right (C2) seconds prior to seizure onset with a rejected action potential marked by “x”, each accepted action potential detection marked (“.”) and an example shown at right. Example action potentials are shown at right on a 5 msec timescale. D) Firing rate for the time period shown in panel A for action potentials shown in panel B. The activity on this microelectrode was classified as “preictal increase”.
Figure 2
Figure 2
Seizure-related activity observed for all recorded data. Each row shows a peri-event (seizure) time histogram (PETH) with one-min bin width for one microelectrode around one seizure (i.e., a “trace”) beginning 45 min prior to seizure onset. Grayscale is normalized to firing during 15 min beginning 45 min prior to onset ranging from black (no firing) to white (twice the baseline firing rate or greater). Traces from the SOZ are at top, ipsilateral MTL outside SOZ middle, and contralateral MTL bottom. Rows are grouped by seizure-related firing rate changes: hollow arrows for preictal changes, solid arrows for post-ictal changes and “NC” for “no change”.
Figure 3
Figure 3
All types of seizure-related firing rate changes were observed in all recorded brain regions. For each activity-related group, grey bars show the expected relative ratios by each anatomical grouping (i.e., grey bars in each group sum to 100%). Colored bars placed on top show the actual percentage of contralateral (blue), ipsilateral outside SOZ (green) and SOZ (red) relative ratios. While SOZ microelectrodes predominate in the preictal-increase and ictal-increase groups and ipsilateral microelectrodes dominate the preictal-decrease group, examples of each seizure-related activity change are observed in all anatomical groups.
Figure 4
Figure 4
Seizure-related activity on microelectrodes is highly variable with regards to Seizure Onset Zone. (LEFT) Schematic of a depth electrode for one seizure containing macroelectrodes (bars), microwires extending from the tip of the electrode (lines) and microwires placed between macroelectrodes on the shaft (dots). Light gray rectangle shows the clinically defined Seizure Onset Zone (SOZ) as determined by low-frequency clinical criteria. Arrows from macroelectrodes and circled microelectrodes point to EEG shown on the right. (RIGHT) EEG and firing rates beginning 45 min prior to seizure onset (“0”). EEG for microelectrodes has been high-pass filtered to show unit activity, but seizures were clearly observed on microelectrodes near the SOZ commensurate with seizure activity observed on the macroelectrodes. Vertical scale is the firing rate normalized to firing rate during 15 min beginning 45 min prior to seizure onset. Note that the scale on the top row is much larger than the other rows. Symbols at right show seizure-related activity change category: hollow arrows show pre-onset changes, solid arrows show post-onset changes and “NC” shows “no change”.
Figure 5
Figure 5
Seizure-to-seizure variability, despite similar macroscopic recordings. Top and bottom panels show 45 sec of data around seizure onset from sequential seizures during the same recording session, separated by 5 hours. EEG recording on the top line of each panel shows data from the same macroelectrode during each seizure. Colored plots below show firing rates for 30 microelectrodes, normalized to the firing rate of each electrode for 15 min beginning 45 min prior to seizure onset. Flat lines show microelectrodes that recorded firing during the baseline period, but showed little or no activity during the seizure.
Figure 6
Figure 6
No change in cross-correlation observed prior to seizure onset. Traces were grouped according to the location of the microelectrode relative to the macroelectrode-determined seizure onset zone: contralateral to (Contra), ipsilateral to (Ipsi) and within (SOZ) the seizure onset zone. (A) Average time-shift normalized cross-correlation across all patients. Significant correlations observed prior to seizure onset did not persist continuously up to seizure onset. (B) Example from one patient showing no pre- or post-ictal changes in cross-correlation.

References

    1. Aertsen AM, Gerstein G, Habib MK, Palm G. Dynamics of neuronal firing correlation: modulation of "effective connectivity". J Neurophysiol. 1989;61:900–917. - PubMed
    1. Babb TL, Crandall PH. Epileptogenesis of human limbic neurons in psychomotor epileptics. Electroencephalogr Clin Neurophysiol. 1976;40:225–243. - PubMed
    1. Babb TL, Wilson CL, Isokawa-Akesson M. Firing patterns of human limbic neurons during stereoencephalography (SEEG) and clinical temporal lobe seizures. Electroencephalogr Clin Neurophysiol. 1987;66:467–482. - PubMed
    1. Bower MR, Buckmaster PS. Changes in granule cell firing rates precede locally recorded spontaneous seizures by minutes in an animal model of temporal lobe epilepsy. J Neurophysiol. 2008;99:2431–2442. - PubMed
    1. Bower MR, Stead M, Brinkmann BH, Dufendach K, Worrell GA. Metadata and annotations for multi-scale electrophysiological data. Conf Proc IEEE Eng Med Biol Soc. 2009;2009:2811–2814. - PMC - PubMed

Publication types