

Reliability of distortion-product otoacoustic emissions and their relation to loudness
- PMID: 22352502
- PMCID: PMC3292604
- DOI: 10.1121/1.3672654
Reliability of distortion-product otoacoustic emissions and their relation to loudness
Abstract
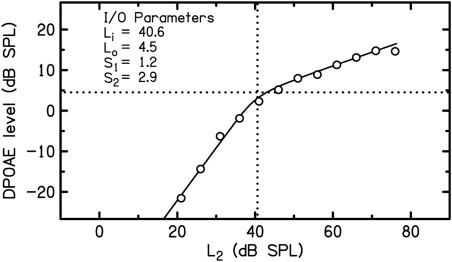
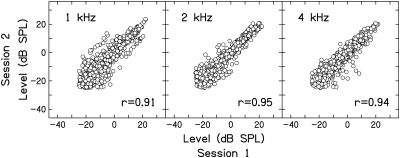
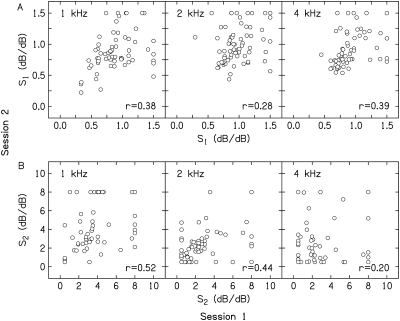
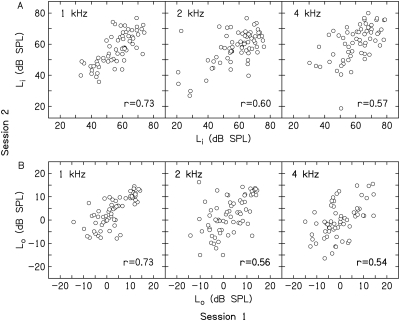
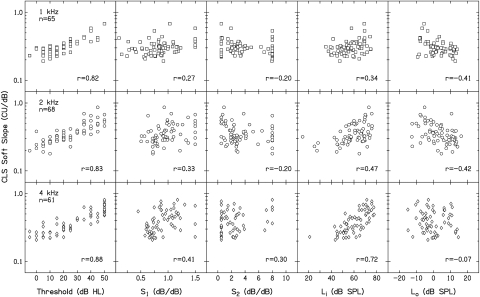
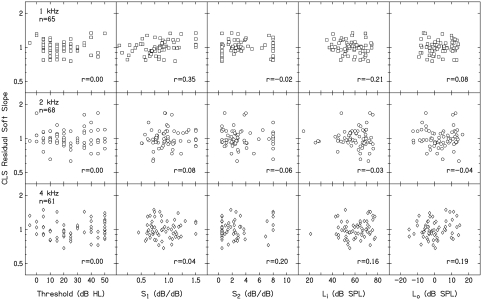
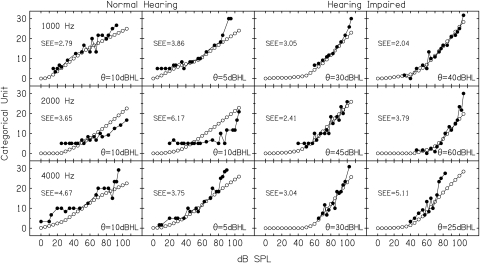
The reliability of distortion-product otoacoustic emission (DPOAE) measurements and their relation to loudness measurements was examined in 16 normal-hearing subjects and 58 subjects with hearing loss. The level of the distortion product (L(d)) was compared across two sessions and resulted in correlations that exceeded 0.90. The reliability of DPOAEs was less when parameters from nonlinear fits to the input/output (I/O) functions were compared across visits. Next, the relationship between DPOAE I/O parameters and the slope of the low-level portion of the categorical loudness scaling (CLS) function (soft slope) was assessed. Correlations of 0.65, 0.74, and 0.81 at 1, 2, and 4 kHz were observed between CLS soft slope and combined DPOAE parameters. Behavioral threshold had correlations of 0.82, 0.83, and 0.88 at 1, 2, and 4 kHz with CLS soft slope. Combining DPOAEs and behavioral threshold provided little additional information. Lastly, a multivariate approach utilizing the entire DPOAE I/O function was used to predict the CLS rating for each input level (dB SPL). Standard error of the estimate when using this method ranged from 2.4 to 3.0 categorical units (CU), suggesting that DPOAE I/O functions can predict CLS measures within the CU step size used in this study (5).
© 2012 Acoustical Society of America
Figures
Similar articles
-
Relation of distortion-product otoacoustic emission input-output functions to loudness.J Acoust Soc Am. 2013 Jul;134(1):369-83. doi: 10.1121/1.4807560. J Acoust Soc Am. 2013. PMID: 23862814 Free PMC article.
-
Reliability of categorical loudness scaling and its relation to threshold.Ear Hear. 2010 Aug;31(4):567-78. doi: 10.1097/AUD.0b013e3181da4d15. Ear Hear. 2010. PMID: 20588122 Free PMC article.
-
The influence of common stimulus parameters on distortion product otoacoustic emission fine structure.Ear Hear. 2012 Mar-Apr;33(2):239-49. doi: 10.1097/AUD.0b013e3182321da4. Ear Hear. 2012. PMID: 21918451 Clinical Trial.
-
Objective audiometry with DPOAEs : New findings for generation mechanisms and clinical applications.HNO. 2017 Aug;65(Suppl 2):122-129. doi: 10.1007/s00106-016-0267-y. HNO. 2017. PMID: 28470484 Free PMC article. Review.
-
[High-resolution distortion-product otoacoustic emissions: method and clinical applications].HNO. 2014 Oct;62(10):718-24. doi: 10.1007/s00106-014-2921-6. HNO. 2014. PMID: 25270969 Review. German.
Cited by
-
Meta-Analysis of Distortion Product Otoacoustic Emission Retest Variability for Serial Monitoring of Cochlear Function in Adults.Ear Hear. 2015 Sep-Oct;36(5):e251-60. doi: 10.1097/AUD.0000000000000176. Ear Hear. 2015. PMID: 25985018 Free PMC article.
-
Effects of relative and absolute frequency in the spectral weighting of loudness.J Acoust Soc Am. 2016 Jan;139(1):373-83. doi: 10.1121/1.4939893. J Acoust Soc Am. 2016. PMID: 26827032 Free PMC article.
-
An active loudness model suggesting tinnitus as increased central noise and hyperacusis as increased nonlinear gain.Hear Res. 2013 Jan;295:172-9. doi: 10.1016/j.heares.2012.05.009. Epub 2012 May 26. Hear Res. 2013. PMID: 22641191 Free PMC article.
-
Long-Term Variability of Distortion-Product Otoacoustic Emissions in Infants and Children and Its Relation to Pediatric Ototoxicity Monitoring.Ear Hear. 2020 Mar/Apr;41(2):239-253. doi: 10.1097/AUD.0000000000000536. Ear Hear. 2020. PMID: 29280917 Free PMC article.
-
Relation of distortion-product otoacoustic emission input-output functions to loudness.J Acoust Soc Am. 2013 Jul;134(1):369-83. doi: 10.1121/1.4807560. J Acoust Soc Am. 2013. PMID: 23862814 Free PMC article.
References
-
- ANSI (2004). S3.6-2004, Specifications for Audiometers (AIP, New York: ).
-
- Beattie, R. C., Kenworthy, O. T., and Neal-Johnson, C. M. (2004). “Distortion product otoacoustic emissions: Input-output functions for primary-tone pairs at 1000, 2000 and 4000 Hz in normal-hearing females,” Aust. N. Z. J. Audiol. 26, 116–132.10.1375/audi.26.2.116.58273 - DOI
Publication types
MeSH terms
Grants and funding
LinkOut - more resources
Full Text Sources
Research Materials
Miscellaneous