. 2012 Feb;131(2):1296-306.
doi: 10.1121/1.3676609.

Influence of acute hyperglycemia on otoacoustic emissions and the medial olivocochlear reflex

Affiliations

Influence of acute hyperglycemia on otoacoustic emissions and the medial olivocochlear reflex

Peter G Jacobs et al. J Acoust Soc Am. 2012 Feb.

Abstract

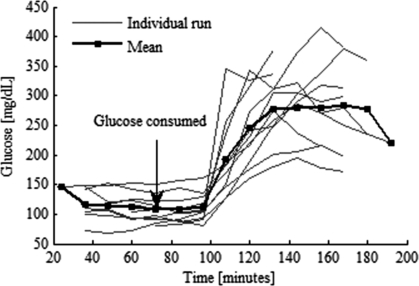
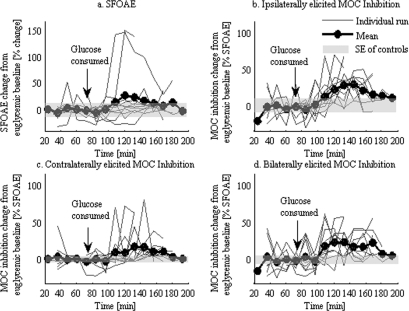
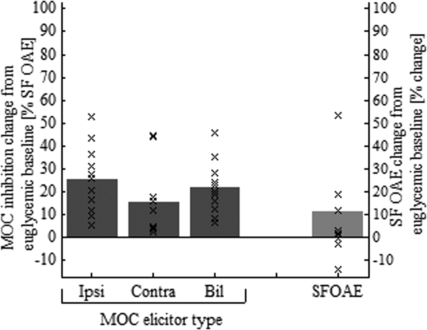
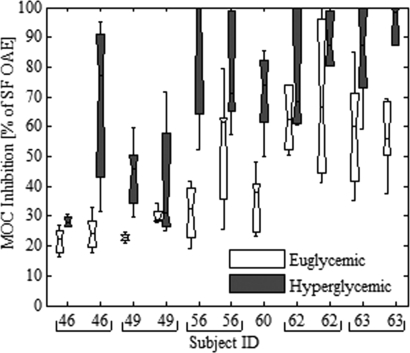
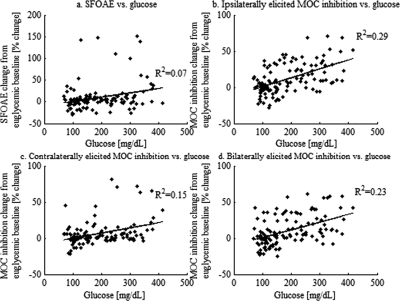
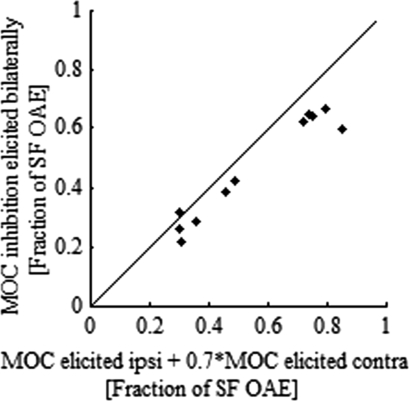
Stimulus-frequency (SF) otoacoustic emission (OAE) amplitude and the amplitude of medial olivocochlear (MOC) inhibition of SF OAEs for ipsilateral, contralateral and bilateral MOC reflex elicitors were recorded in six subjects with type 2 diabetes during a glucose tolerance test (GTT). Five of the six subjects were tested twice for a total of 11 trials and three subjects were tested in a control experiment. During the GTT experiment, the subjects' blood glucose was elevated from a euglycemic level below 150 mg/dL to a hyperglycemic level above 160 mg/dL following the consumption of a bolus of 80 g of sugar. A subset of three subjects were tested in a control experiment during which SF OAE and MOC reflex measurements were made while blood sugar levels remained constant within the euglycemic region. Mean SF OAE amplitudes were elevated following glucose consumption. A statistically significant increase in MOC inhibition amplitude was observed during elevated sugar levels for the 11 GTT trials. Maximum inhibition occurred about an hour after glucose consumption when blood glucose levels peaked. Results indicate that acute hyperglycemia influences efferent control of the cochlea in people with type 2 diabetes.


Figures

Figure 1
Figure 1
Increase in blood sugar during the glucose tolerance test for all individual test runs (light gray) and the mean value increase (black).
Figure 2
Figure 2
Method for measuring MOC inhibition of OAE using vector subtraction (Guinan, Backus, Lilaonitkul, and Aharonson, 2003). Total pressure in the ipsilateral ear is first measured in a baseline window, while presenting a tone to the ear, which evokes the SF OAE. While the tone is still being presented, an MOC elicitor is presented (noise) either ipsilaterally, contralaterally, or bilaterally. If the MOC elicitor is presented contralaterally, then the effect of the MOC elicitor on the SF OAE can be measured during the presentation of the elicitor. If the MOC is presented ipsilaterally or bilaterally, then the MOC must be measured after the elicitor has turned off—within a post-elicitor window. The MOC complex amplitude (VMOC) and phase angle (Φ) are calculated by vector-subtracting the total pressure measured in the elicitor or post- elicitor measurement window from the total pressure measured in a baseline window.
Figure 3
Figure 3
Change in SF OAE amplitude (a) and MOC inhibition of SF OAE amplitude during a glucose tolerance test for three MOC elicitation methodologies; (b) ipsilateral, (c) contralateral, and (d) bilateral stimulus presentation. Results are shown for each individual test run (light gray traces) and the mean across all runs (black traces). Notice that while there is variability for individual subject runs, the average SF OAE amplitude and the average MOC inhibition amplitude measured using each of the three elicitors all demonstrated an increase shortly after the consumption of sugar. The light grey shaded region of the plot represents the standard error (SE) of the control runs where the subjects consumed only water, and no sugar.
Figure 4
Figure 4
Results showing how MOC inhibition of SF OAEs increased across all three elicitors during hyperglycemia compared with euglycemia on average (bars) and for every individual trial (×). Results also show that the SF OAE amplitude increased on average 11.3% (1.8 dB) during hyperglycemia relative to the baseline euglycemia measurement period, however several subjects showed a reduced SF OAE amplitude during hyperglycemia or no change at all. Data are plotted as a percent change from the euglycemic baseline average.
Figure 5
Figure 5
MOC inhibition amplitude (elicited ipsilaterally) measured during euglycemia and hyperglycemia for all subjects. Results above show box and whisker plots displaying the mean value (line) and variance of MOC inhibition amplitude both under euglycemic conditions and hyperglycemic conditions. The horizontal axis groups identical subject IDs to indicate that five of the six subjects were tested twice. Results from the first test are shown, and re-test results taken on a different day are also shown for these five subjects.
Figure 6
Figure 6
Change in SF OAE amplitude (a) and MOC inhibition for three elicitor types, ipsilateral (b), contralateral (c), and bilateral (d) during hyperglycemia plotted as a function of glucose. The lines on the plots show the least-squares line fit. The correlation coefficients (R2) are shown on the individual plots.
Figure 7
Figure 7
Relationship between MOC inhibition elicited ipsilaterally, contralaterally, and bilaterally during euglycemia. The MOC elicited contralaterally was recorded during the elicitor window while the MOC elicited ipsilaterally and bilaterally was elicited in a post-elicitor window 40 ms after the MOC elicitor turned off. Guinan, Backus, Lilaonitkul, and Aharonson (2003) showed that the size of the MOC inhibition measured in the post-elicitor was approximately 3 dB smaller than when measured at the time of the elicitor. For this reason, we multiplied the contralaterally elicited MOC by 0.7, added it to the ipsilaterally elicited MOC, and then plotted that value versus the MOC elicited bilaterally. They should correlate exactly and have nearly a 1-to-1 correspondence, which is shown as the solid line on the plot.

Similar articles

Cited by

References

    1. American Diabetes Association (2011). “Standards of medical care in diabetes—2011,” ADA 34(Suppl. 1), S11–61. - PMC - PubMed
    1. Angelie, R. D., Lavinsky, L., and Dolganov, A. (2009). “Alterations in cochlear function during induced acute hyperinsulinemia in an animal model,” Braz. J. Otorhinolaryngol. 75, 760–764.10.1590/S1808-86942009000500024 - DOI - PMC - PubMed
    1. Ashmore, J. F., and Ohmori, H. (1990). “Control of intracellular calcium by ATP in isolated outer hair cells of the guinea-pig cochlea,” J. Physiol. 428, 109–131. - PMC - PubMed
    1. Bainbridge, K. E., Cheng, Y. J., and Cowie, C.C. (2010). “Potential mediators of diabetes-related hearing impairment in the U.S. population: National Health and Nutrition Examination Survey 1999–2004,” Diabetes Care 33, 811–816.10.2337/dc09-1193 - DOI - PMC - PubMed
    1. Berlin, C. (2002). Hair Cell Micro-mechanics and Otoacoustic Emissions (Delmar Learning, Thomason Learning, Clifton Park, NY: ), pp. 1–155.

Publication types