. 2012 Feb;131(2):1401-12.
doi: 10.1121/1.3672686.

Neuromuscular control of fundamental frequency and glottal posture at phonation onset

Affiliations

Neuromuscular control of fundamental frequency and glottal posture at phonation onset

Dinesh K Chhetri et al. J Acoust Soc Am. 2012 Feb.

Abstract

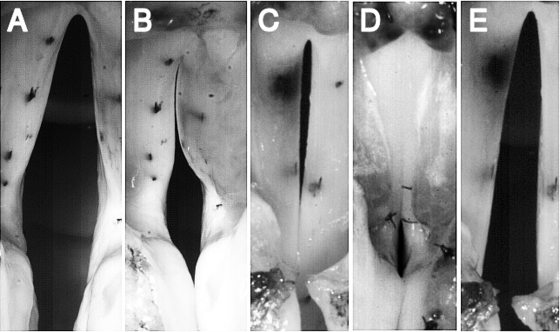
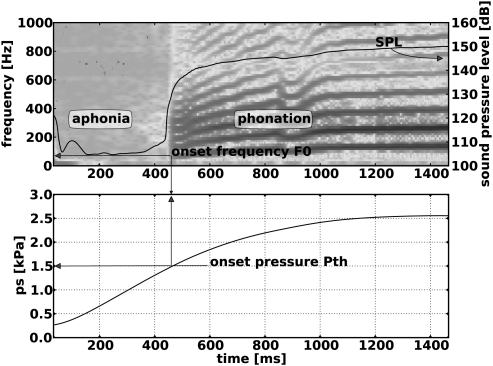
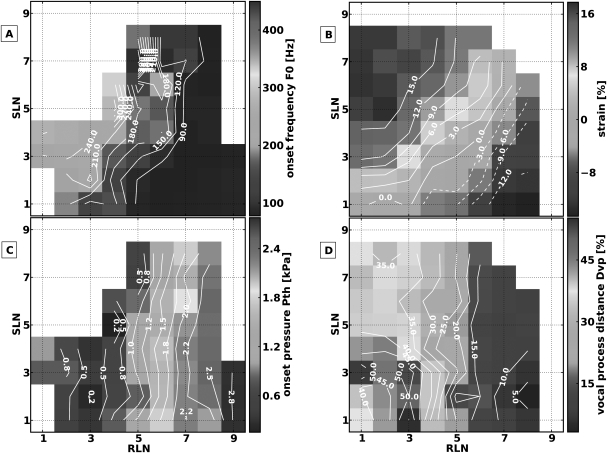
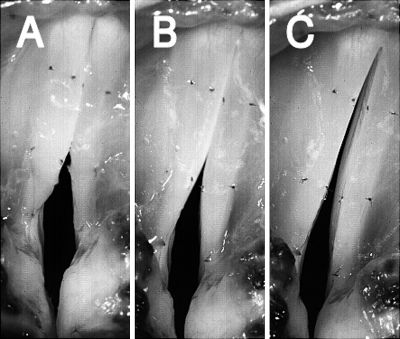
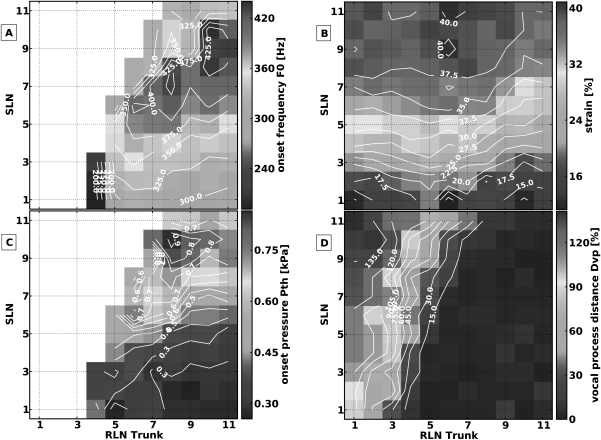
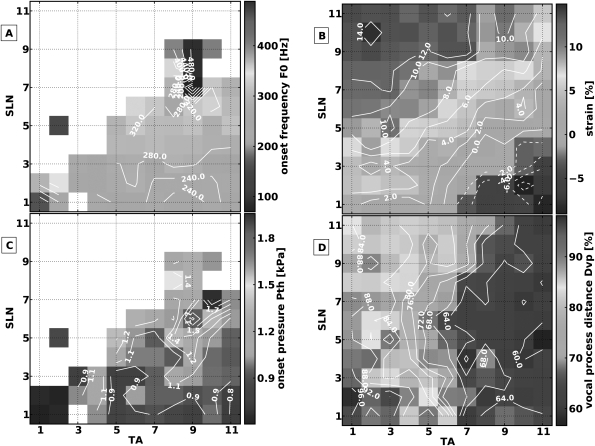
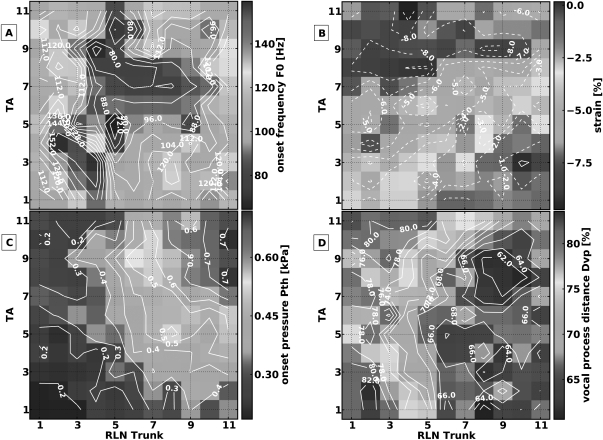
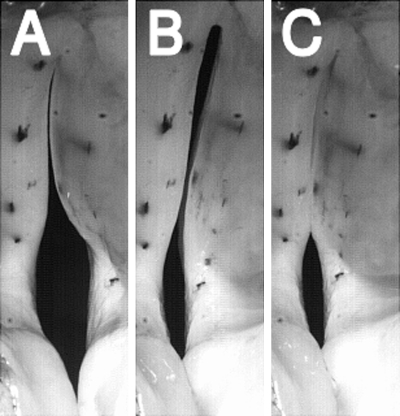
The laryngeal neuromuscular mechanisms for modulating glottal posture and fundamental frequency are of interest in understanding normal laryngeal physiology and treating vocal pathology. The intrinsic laryngeal muscles in an in vivo canine model were electrically activated in a graded fashion to investigate their effects on onset frequency, phonation onset pressure, vocal fold strain, and glottal distance at the vocal processes. Muscle activation plots for these laryngeal parameters were evaluated for the interaction of following pairs of muscle activation conditions: (1) cricothyroid (CT) versus all laryngeal adductors (TA/LCA/IA), (2) CT versus LCA/IA, (3) CT versus thyroarytenoid (TA) and, (4) TA versus LCA/IA (LCA: lateral cricoarytenoid muscle, IA: interarytenoid). Increases in onset frequency and strain were primarily affected by CT activation. Onset pressure correlated with activation of all adductors in activation condition 1, but primarily with CT activation in conditions 2 and 3. TA and CT were antagonistic for strain. LCA/IA activation primarily closed the cartilaginous glottis while TA activation closed the mid-membranous glottis.


Figures

Figure 1
Figure 1
Glottal posture changes induced by activation of the intrinsic laryngeal muscles: (a) the condition of no activation, (b) TA activation caused medial bulging and glottal closure at the mid-membranous glottis but a gap persists in the cartilaginous (posterior) glottis, (c) LCA/IA activation caused vocal fold adduction and complete closure at the cartilaginous glottis but a mid-membranous gap remains, (d) activation of all the adductors (TA/LCA/IA) causes glottal closure at both membranous and cartilaginous glottis, and (e) CT activation causes lengthening of the vocal fold.
Figure 2
Figure 2
(Color online) Subglottic acoustic spectrogram (top) and subglottic pressure Psub (bottom) over the entire stimulation duration (1500 ms) for one representative SLN/RLN activation condition, illustrating a typical experimental observation. Psub starts to slowly rise after the beginning of stimulation pulse train. After a period of aphonia a large increase in subglottal sound pressure level (SPL) occurs at phonation onset, after which both Psub and F0 continue to rise slowly.
Figure 3
Figure 3
(Color online) Muscle activation plots for muscle activation condition 1: CT versus all laryngeal adductors (TA/LCA/IA). (A) onset F0, (B) strain (ɛ), (C) onset subglottic pressure (Pth), and (D) glottal distance between the vocal processes (Dvp). Graded stimulation was applied to the SLN and RLN (after division of PCA branches) to activate the CT muscle and laryngeal adductors respectively.
Figure 4
Figure 4
High-speed images of glottal configuration in muscle activation condition 1 (CT versus [TA/LCA/IA] activation), demonstrating the changes in prephonatory posture in regions of transition from phonation to aphonia. In the figure, RLN stimulation is kept constant (activation level 3) while CT activation (SLN stimulation) is increased from threshold to maximal. Images correspond to activation levels in shown in Fig. 3. (A) RLN level 3, CT level 1, (B) RLN 3, CT 4, and (C) RLN 3, CT 8.
Figure 5
Figure 5
(Color online) Muscle activation plots for muscle activation condition 2 (CT versus LCA/IA). (A) Onset F0, (B) strain (ɛ), (C) onset subglottic pressure (Pth), and (D) glottal distance between the vocal processes (Dvp). Graded stimulation was applied to the SLN and RLN trunk (after division of PCA and TA branches) to activate the CT muscle and LCA/IA muscle complex, respectively.
Figure 6
Figure 6
High-speed images of glottal configuration in muscle activation condition 2 (CT versus LCA/IA), demonstrating the changes in prephonatory posture in regions of transition from phonation to aphonia. LCA/IA activation (via RLN Trunk stimulation) is kept constant (activation level 5) while CT activation (SLN stimulation) is increased from threshold to maximal. Images correspond to activation levels shown in Fig. 5. (A) LCA/IA level 5, CT level 1, (B) LCA/IA 5, CT 6, (C) LCA/IA 5 CT 11.
Figure 7
Figure 7
(Color online) Muscle activation plots for muscle activation condition 3 (CT versus TA). (a) onset F0, (b) strain (ɛ), (c) onset subglottic pressure (Pth), and (d) glottal distance between the vocal processes (Dvp).
Figure 8
Figure 8
High-speed images of glottal configuration in muscle activation condition 3 (CT versus TA), demonstrating the changes in pre-phonatory posture in regions of transition from phonation to aphonia. TA activation is kept constant (activation level 7) while CT activation is increased from threshold to maximal. Images correspond to activation levels shown in Fig. 7. (a) TA level 7, CT level 1, (b) TA 7, CT 6, (c) TA 7, CT 11.
Figure 9
Figure 9
(Color online) Muscle activation plots for muscle activation condition 4 (TA versus LCA/IA). (a) onset F0, (b) strain (ɛ), (c) onset subglottic pressure (Pth), and (d) glottal distance between the vocal processes (Dvp).
Figure 10
Figure 10
High-speed images of glottal configuration in muscle activation condition 4 (TA versus LCA/IA), demonstrating the interactions between the membranous adduction due to TA activation and cartilaginous adduction due to LCA/IA activation. Images correspond to activation levels shown in Fig. 9. (A) TA level 11, (LCA/IA) level 1, (B) TA 1, (LCA/IA) 11, (C) TA 11, (LCA/IA) 11.

References

    1. Atkinson, J. E. (1978). “Correlation analysis of the physiological factors controlling fundamental voice frequency,” J. Acoust. Soc. Am. 63, 211–222.10.1121/1.381716 - DOI - PubMed
    1. Berke, G. S., Moore, D. M., Hantke, D. R., Hanson, D. G., Gerratt, B. R., and Burstein, F. (1987). “Laryngeal modeling: theoretical, in vitro, in vivo,” Laryngoscope 97, 871–881.10.1288/00005537-198707000-00019 - DOI - PubMed
    1. Chhetri, D. K., Neubauer, J., and Berry, D. A. (2010). “Graded activation of the intrinsic laryngeal muscles for vocal fold posturing,” J. Acoust. Soc. Am. 127, EL127–EL133.10.1121/1.3310274 - DOI - PMC - PubMed
    1. Choi, H. S., Berke, G. S., Ye, M., and Kreiman, J. (1993a). “Function of the thyroarytenoid muscle in a canine laryngeal model,” Ann. Otol. Rhinol. Laryngol. 102, 769–776. - PubMed
    1. Choi, H. S., Berke, G. S., Ye, M., and Kreiman J. (1993b). “Function of the posterior cricoarytenoid muscle in phonation: In vivo laryngeal model,” Otolaryngol. Head Neck Surg. 109(6), 1043–1051. - PubMed

Publication types