. 2012 Jan;17(1):015003.
doi: 10.1117/1.JBO.17.1.015003.

Investigating photoexcitation-induced mitochondrial damage by chemotherapeutic corroles using multimode optical imaging

Affiliations

Investigating photoexcitation-induced mitochondrial damage by chemotherapeutic corroles using multimode optical imaging

Jae Youn Hwang et al. J Biomed Opt. 2012 Jan.

Abstract

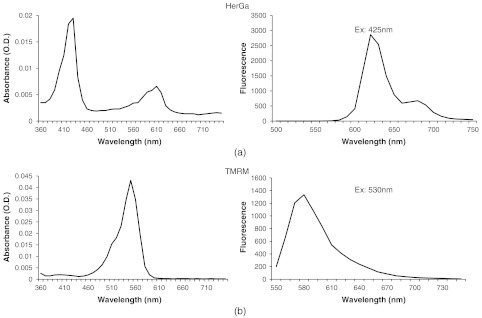
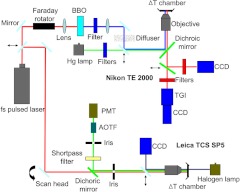
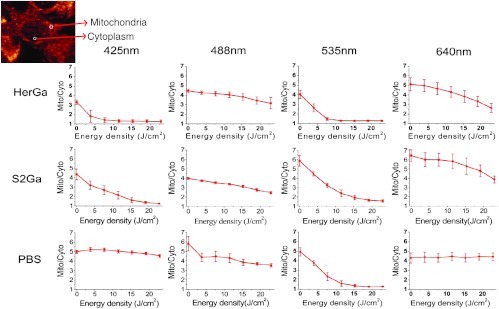
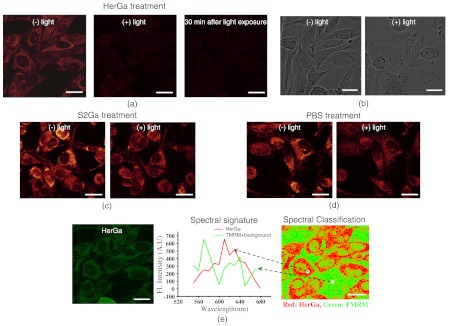
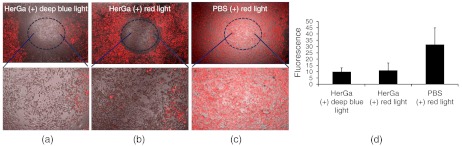
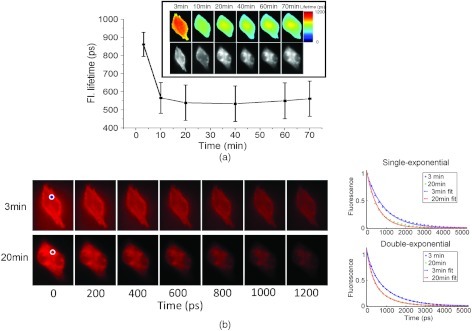
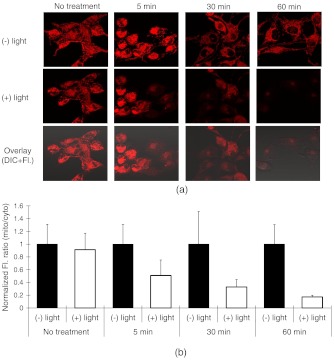
We recently reported that a targeted, brightly fluorescent gallium corrole (HerGa) is highly effective for breast tumor detection and treatment. Unlike structurally similar porphryins, HerGa exhibits tumor-targeted toxicity without the need for photoexcitation. We have now examined whether photoexcitation further modulates HerGa toxicity, using multimode optical imaging of live cells, including two-photon excited fluorescence, differential interference contrast (DIC), spectral, and lifetime imaging. Using two-photon excited fluorescence imaging, we observed that light at specific wavelengths augments the HerGa-mediated mitochondrial membrane potential disruption of breast cancer cells in situ. In addition, DIC, spectral, and fluorescence lifetime imaging enabled us to both validate cell damage by HerGa photoexcitation and investigate HerGa internalization, thus allowing optimization of light dose and timing. Our demonstration of HerGa phototoxicity opens the way for development of new methods of cancer intervention using tumor-targeted corroles.


Figures

Fig. 1
Fig. 1
Absorption (left) and emission spectra (right) of (a) HerGa and (b) TMRM.
Fig. 2
Fig. 2
Experimental setup for multimode optical imaging: fs pulsed laser light is delivered into the Leica and Nikon microscope for the excitation of specimens. For the fluorescence lifetime imaging, the fs pulsed laser light (424 nm) is frequency-doubled through a BBO crystal. The frequency-doubled pulsed laser light is delivered to samples in a delta T chamber through several mirrors, a diffuser, a dichroic mirror, and an objective. Fluorescence detection is realized by TGI and CCD. For epi-fluorescence imaging, the filtered light from an Hg lamp is used to excite the samples. The fluorescence from the samples is recorded in CCD through an emission filter. For two-photon excited fluorescence imaging, fs pulsed light is directly delivered into the sample through a scan head, an iris, and an objective; then, the fluorescence is detected by a photomultiplier tube (PMT) through a shortpass filter, an iris, and AOTF. The CCD is used for DIC imaging.
Fig. 3
Fig. 3
Light wavelength-dependent disruption of mitochondrial membrane potential in cells treated with HerGa or controls: TMRM fluorescence images of cells treated with HerGa (1 μM), S2Ga (1 μM), or PBS were obtained after light irradiation at different wavelengths (425, 488, 535, and 640 nm) and with different energies per area (3.8  J/cm2, 7.6  J/cm2, 11.4  J/cm2, 15.2  J/cm2, 19  J/cm2, and 22.8  J/cm2) using epi-fluorescence imaging (objective: 40×, excitation: 535 nm and emission: 580 nm). Graphs depict the ratio of average fluorescence intensities for mitochondria:cytoplasm of selected cells (N=15 cells per a field of view). Arrows indicate the cytoplasmic and mitochondrial regions, respectively.
Fig. 4
Fig. 4
Mitochondrial membrane potential/morphologic changes of cells receiving HerGa treatment before and after light irradiation and spectral imaging to distinguish HerGa from TMRM: The TMRM fluorescence images of treated cells were acquired before and after light irradiation using two-photon excited confocal fluorescence imaging. Meanwhile, the DIC images were acquired before and after light irradiation using a CCD camera coupled with the two-photon imaging system. After the light irradiation, HerGa could be discriminated from TMRM by collecting the two-photon excited fluorescence images within the spectral range of 550 to 680 nm with a step size of 10 nm. (a) TMRM fluorescence images of HerGa-treated cells before (left) and after the light irradiation (middle and right at 30 min). (b) DIC images before and after light irradiation. (c) TMRM fluorescence images of S2Ga treated (left) and (d) control cells (PBS) (right) /+ light (450 to 490 nm, 17  J/cm2). (e) HerGa fluorescence image (left) and spectral classification image (right, red: HerGa, green: TMRM).
Fig. 5
Fig. 5
Mitochondrial disruption of HerGa-treated cells by red light. TMRM fluorescence images were acquired at two hours after the addition of TMRM to cells treated with 1 μM HerGa and PBS. Cells within the confined area only (delineated by a dotted line) received either deep blue light (414 to 434 nm) or red light (590 to 630 nm), where indicated. (a) Overlaid TMRM fluorescence and transmission image of HerGa-treated cells receiving deep blue light. (b) Overlaid TMRM fluorescence and transmission image of HerGa-treated cells receiving red light. (c) Overlaid TMRM fluorescence and transmission image of PBS-treated cells receiving red light. (d) Mean fluorescence intensities of the area received light. The bar graph represents the mean fluorescence intensity.
Fig. 6
Fig. 6
Fluorescence lifetime changes of HerGa during uptake in MDA-MB-435 cells: (a) fluorescence lifetime (inset, upper panels) and intensity (inset, lower panels) images of treated cells acquired at the indicated time points (3, 10, 20, 40, 60, and 70 min) of HerGa internalization. The plot shows the changes of average fluorescence lifetime of HerGa at the indicated time points. (b) Gated images (left) and single- and double-exponential fittings (right) obtained at 3 and 20 min after HerGa addition.
Fig. 7
Fig. 7
Mitochondrial disruption of HerGa-treated cells by light irradiation at the indicated time points after HerGa addition: (a) TMRM images obtained before and after light irradiation at 5, 30, and 60 min after HerGa addition and without HerGa treatment and overlaid TMRM and DIC image after light irradiation. (b) Quantitative analysis for mitochondrial membrane potential disruption. The bar graph represents the average mitochondrial membrane potential. The error bars indicate standard deviations.

Similar articles

Cited by

References

    1. Agadjanian H., et al. , “Tumor detection and elimination by a targeted gallium corrole,” Proc. Natl. Acad. Sci. U. S. A. 106(15), 6105–6110 (2009).PNASA610.1073/pnas.0901531106 - DOI - PMC - PubMed
    1. Agadjanian H., et al. , “Specific delivery of corroles to cells via noncovalent conjugates with viral proteins,” Pharm. Res. 23(2), 367–377 (2006).PHREEB10.1007/s11095-005-9225-1 - DOI - PubMed
    1. Lim P., et al. , “Differential cytostatic and cytotoxic action of metallocorroles against human cancer cells: potential platforms for anticancer drug development,” Chem. Res. Toxicol. (in press).10.1021/tx200452w - DOI - PubMed
    1. Medina-Kauwe L. K., et al. , “Nonviral gene delivery to human breast cancer cells by targeted Ad5 penton proteins,” Gene Ther. 8(23), 1753–1761 (2001).GETHEC10.1038/sj.gt.3301583 - DOI - PubMed
    1. Agadjanian H., et al. , “Corrole Conjugates: A Unique Approach to Tumor Targeting,” in The American Association for Cancer Research, San Diego, CA, pp. 2328 (2008).

Publication types

MeSH terms